The New Skyscrapers Are Server Farms
Andrew Lawrence said record monuments open into crises. This cycle's monument isn't a tower — it's the data center, and it opens in 2027.
By Baron Mulberry
A newsletter made the rounds this week — Property Cycle Investor, by Darren Wilson — warning readers off buying a house this year or next. Good instinct, familiar evidence: copper soaring, the skyscraper index flashing, rates doing their damage. But the newsletter used a man's life's work without ever saying his name. Operators credit their sources. So before anything else: the credit.
The man who named the pattern
The Skyscraper Index belongs to Andrew Lawrence, property research director at the investment bank Dresdner Kleinwort Wasserstein. His paper — "The Skyscraper Index: Faulty Towers!" — is dated January 15, 1999. He wrote it as Malaysia's Petronas Towers, then the tallest buildings on Earth, were being completed straight into the Asian financial crisis.
Lawrence's observation, in plain words: the world's tallest buildings keep getting finished on the eve of economic crises. Not because towers cause crashes. Because a record-breaking monument only gets financed when two things peak at the same time — confidence and credit. Everybody believes. Every bank lends. And because the build takes years, the doors open into a different economy than the one that signed the checks.
Economist Mark Thornton of the Mises Institute later built a proper model on Lawrence's index — and in early August 2007, Thornton flagged the signal live, before the global financial crisis unwound. Credit where it's due: Lawrence named it, Thornton weaponized it.
The canon, with the dates right
The pattern is famous enough that people now tell it sloppy. Told tight, with correct dates, it's worse — better — than the folklore.
Empire State Building. Announced in 1929, construction began in March 1930 — after the crash, on momentum and borrowed conviction — and it opened in May 1931 into the teeth of the Depression. New Yorkers nicknamed it the "Empty State Building." It took years to fill.
World Trade Center and Sears Tower. Completed 1972 to 1974, straight into stagflation (prices rising while the economy stalls) and the oil shock.
Petronas Towers. Completed 1998, into the Asian financial crisis that was burning through Malaysia's neighbors as the cranes came down.
Burj Khalifa. Construction began in 2004, in the fattest years of the global credit boom. It opened in January 2010 — weeks after Dubai's November 2009 debt standstill, when the emirate admitted it couldn't pay. The tower was renamed mid-crisis: announced as Burj Dubai, it opened as Burj Khalifa, named for Abu Dhabi's ruler, after Abu Dhabi's bailout money kept Dubai standing. The monument literally carries the rescuer's name.
Read the mechanism once more, because it's the whole article: cheap credit, plus peak confidence, plus a build that takes years, equals a monument that opens into the downturn. The building is not the cause. The building is the thermometer.
The new monument is a server farm
Now look at this cycle and ask where the record-breaking monument is. It isn't a tower. Nobody is racing to touch the sky. The monument of this cycle sits flat on farmland, behind fences and substations, and it hums.
It's the hyperscale data center — the warehouse-sized buildings full of servers that run the artificial-intelligence boom. ("Hyperscalers" are the handful of giants building them: Amazon, Alphabet — Google's parent — Microsoft, Meta, and Oracle.) And the spending is beyond anything the tower-builders ever dreamed of.
The Big Four hyperscalers spent roughly $410 billion on capital spending (capex: the money a company spends building long-lived things — buildings, servers, equipment) in 2025. Their guidance — the spending plans they've announced to investors — for 2026: roughly $725 billion. Up 77% in one year. Add Oracle and the Big Five guide to $775–800 billion. And note the direction of the revisions through 2026: every single one went up. None went down. That is what peak confidence looks like in a spreadsheet.
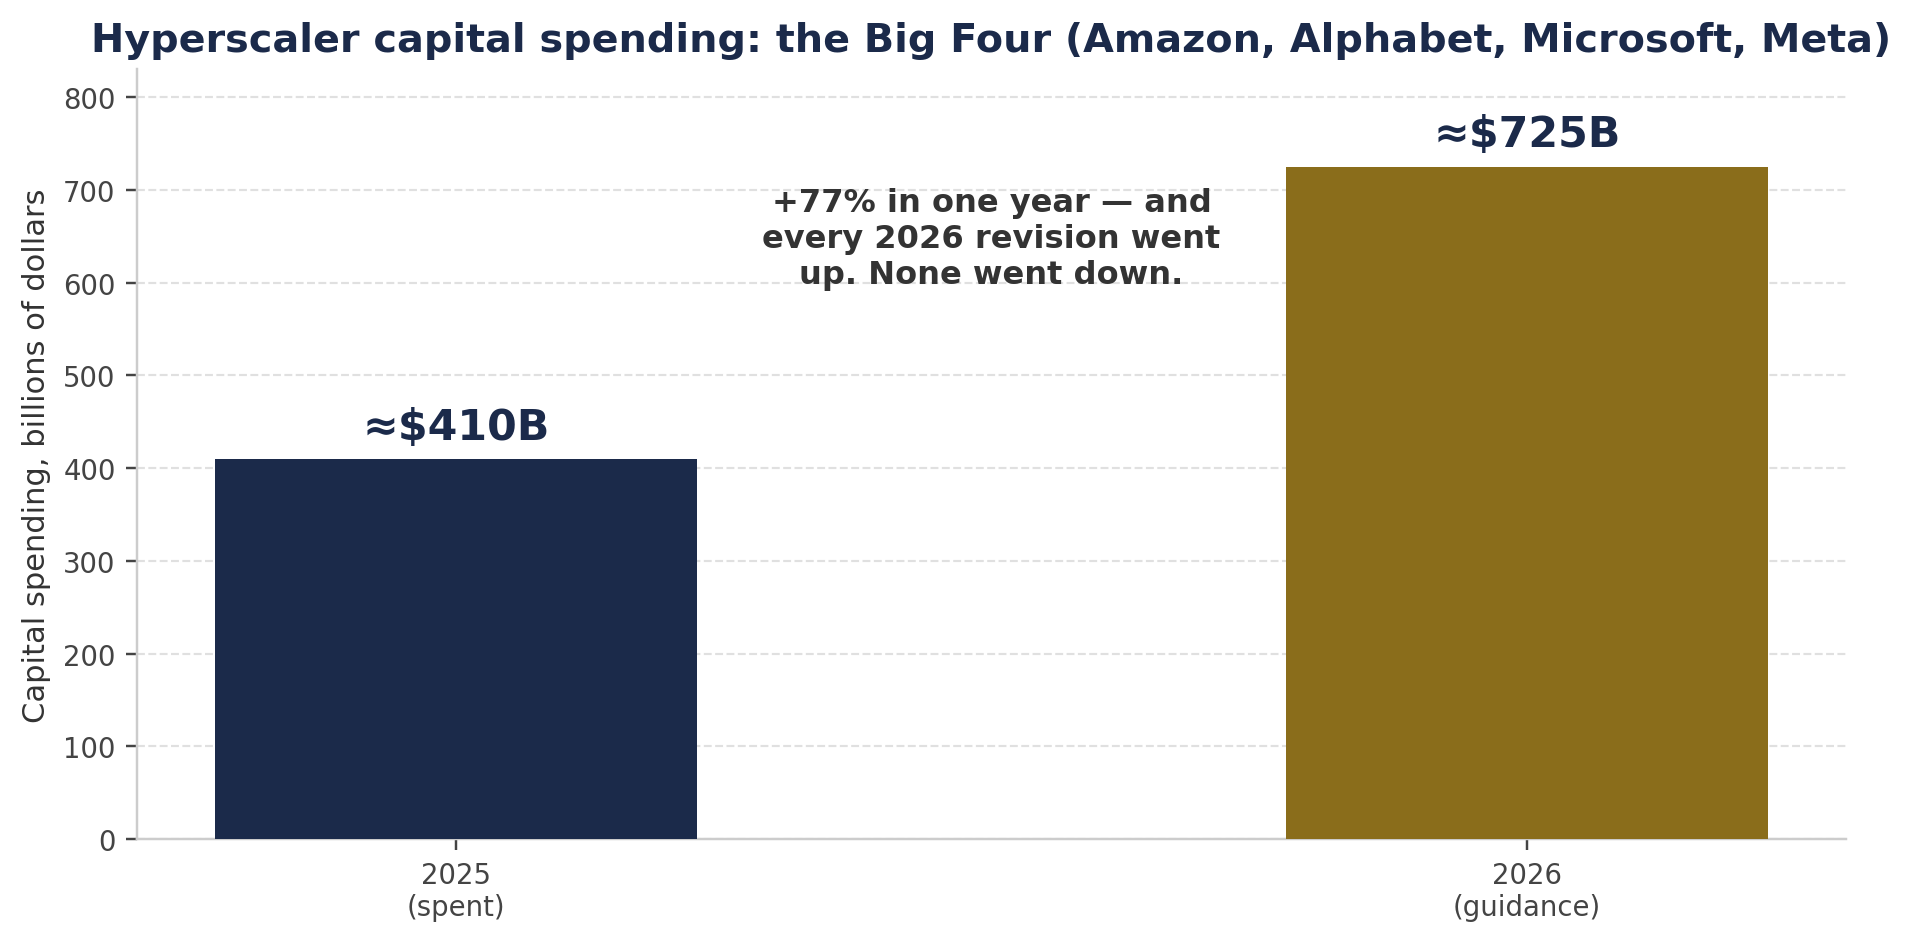
Chart 1 — Capital spending by the Big Four hyperscalers (Amazon, Alphabet, Microsoft, Meta): ≈$410B spent in 2025 vs ≈$725B guided for 2026 (+77%). The 2026 bar is company guidance — announced plans, not realized spending. Source: company Q2 2026 earnings disclosures, guidance compiled as of August 7, 2026.
The federal government's own construction census tells the same story from the dirt up. The Census Bureau counts private data center construction at a record $85.0 billion annual pace in August 2026 — up 73% from a year earlier. And that figure is buildings only: the Census counts the shell, the concrete, the power gear — it excludes the billions in servers that go inside. Even the understatement is a record.
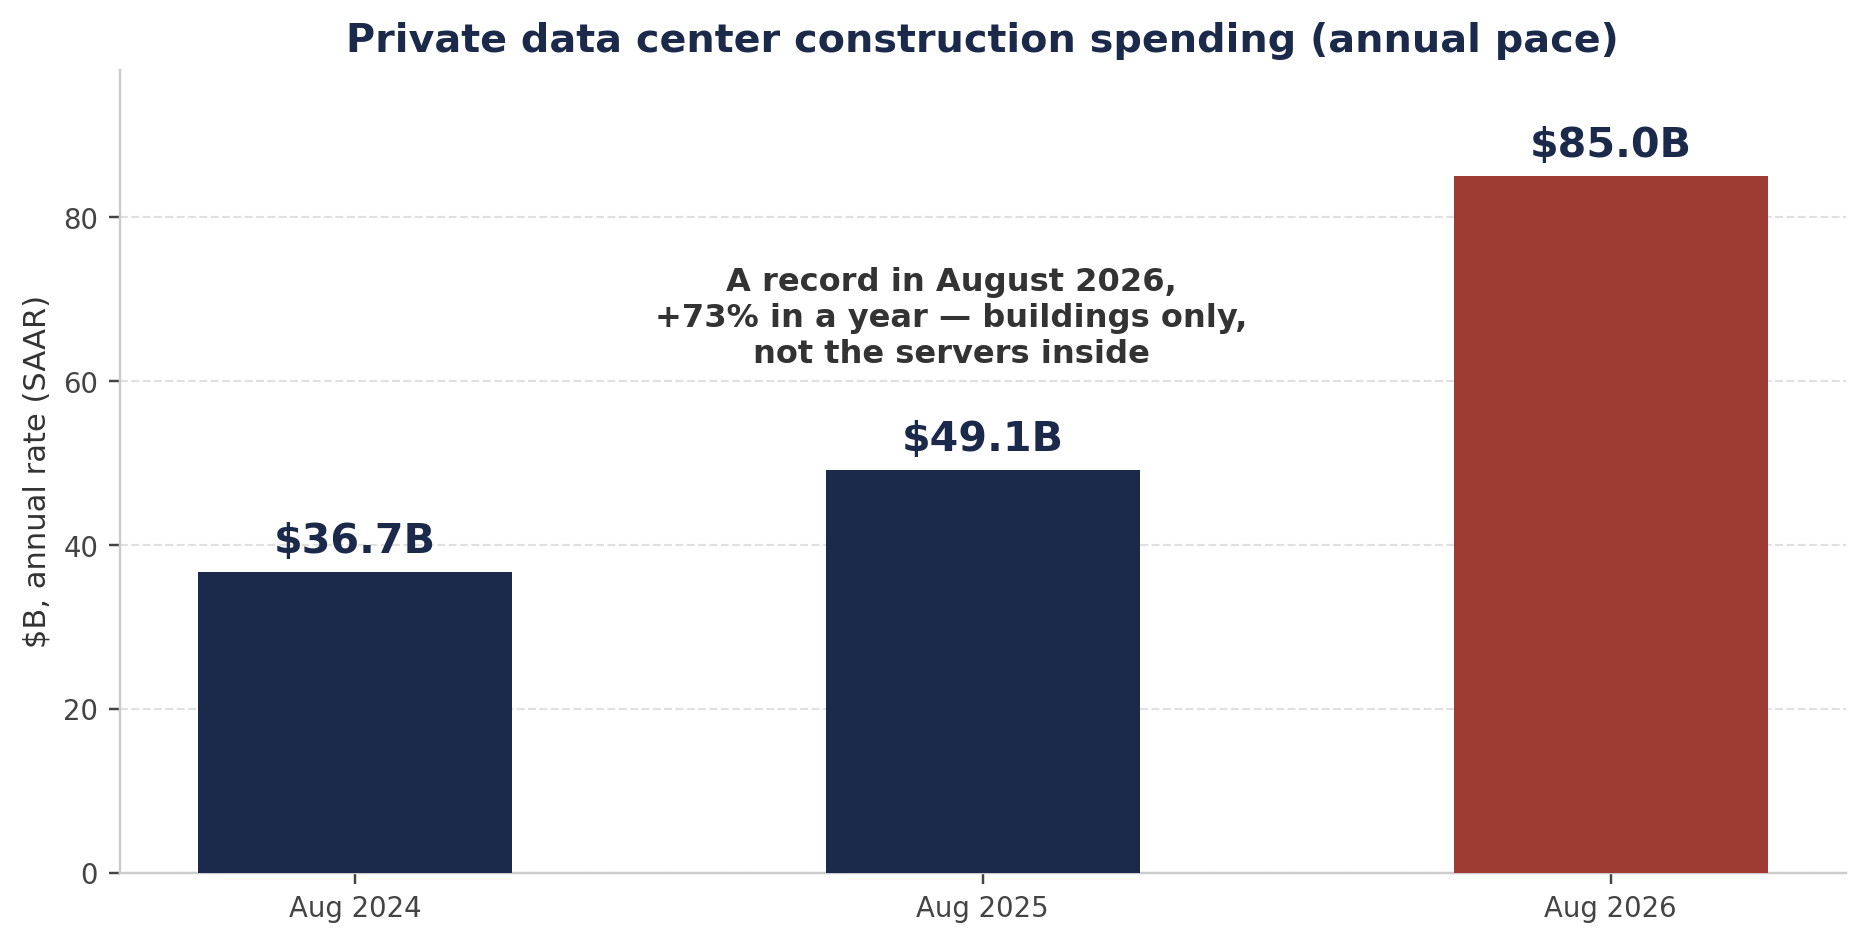
Chart 2 — Private data center construction spending at a seasonally adjusted annual rate: $36.7B (Aug 2024), $49.1B (Aug 2025), a record $85.0B (Aug 2026). Buildings only — Census excludes servers and equipment installed inside. Source: U.S. Census Bureau, Construction Spending (C30), August 2026 release.
Here is the crossover that belongs on a poster. Data centers are now 63% of all private office construction in America — and they outspend general office buildings $85.0 billion to $45.8 billion, nearly two to one. The office — the actual office, where people sit — is now the side business. The server farm is the main event.
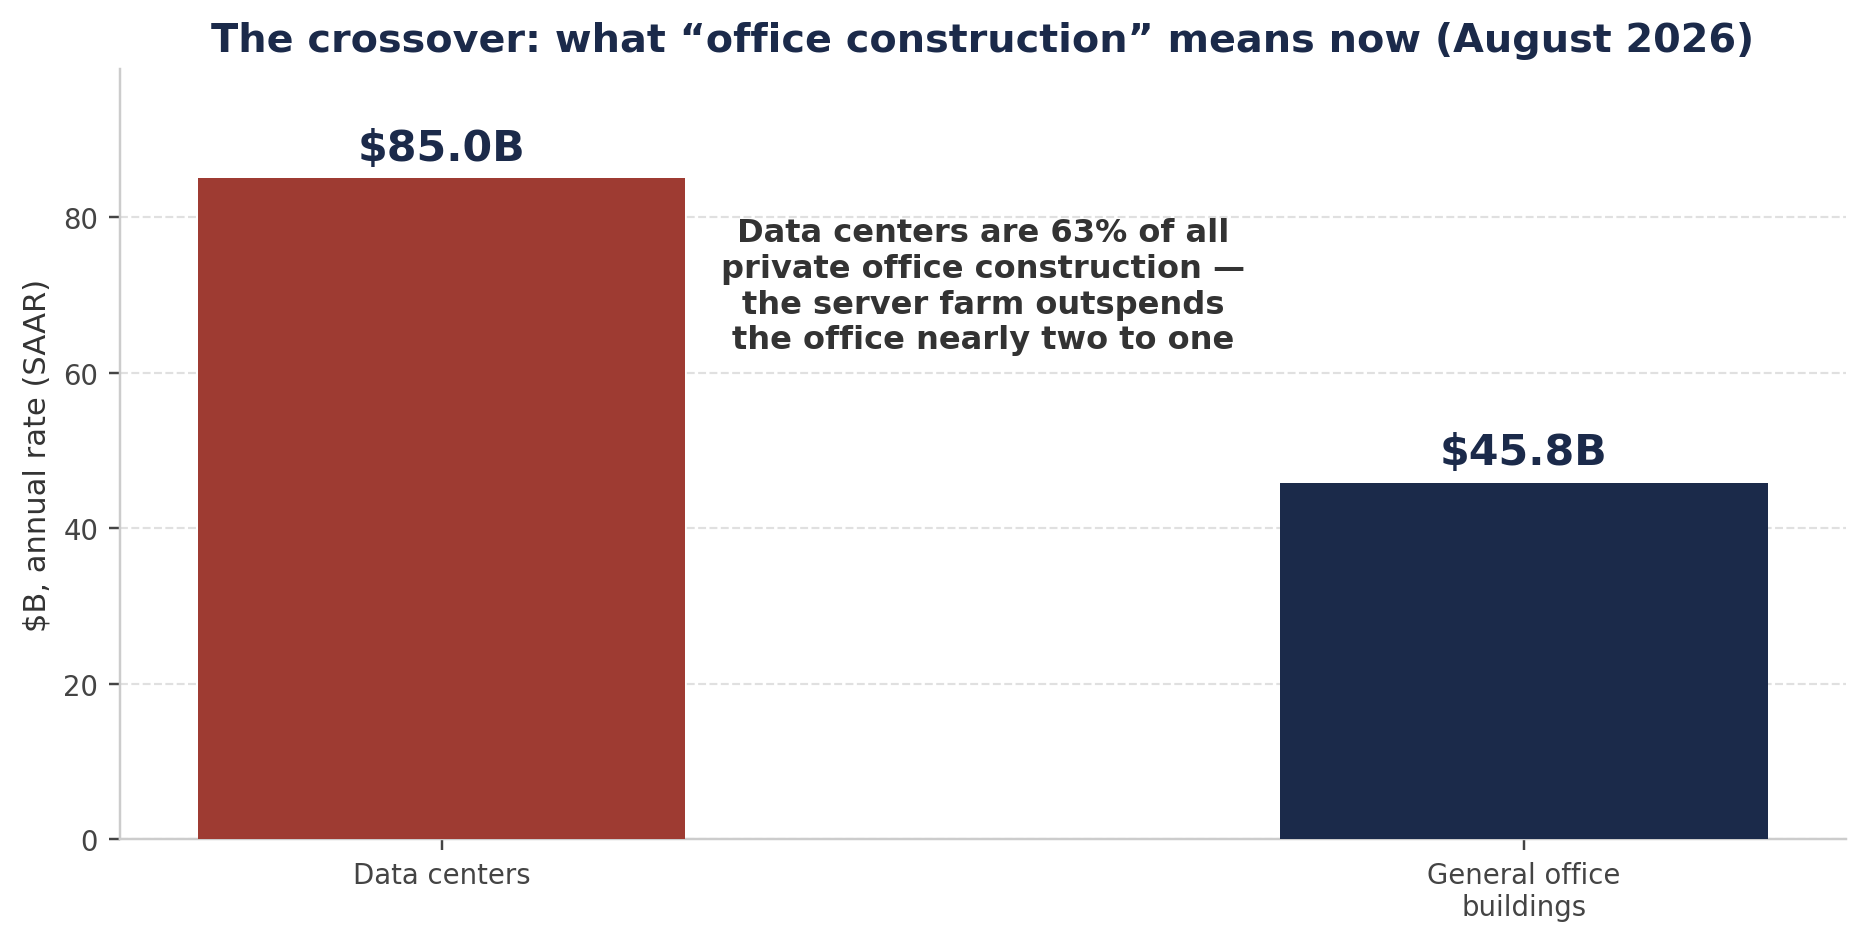
Chart 3 — The crossover, August 2026 (seasonally adjusted annual rate): data center construction $85.0B vs general office construction $45.8B. Data centers are 63% of private office construction. Source: U.S. Census Bureau, Construction Spending (C30), August 2026 release.
The biggest single announcement marker: Stargate — OpenAI, SoftBank, and Oracle's $500 billion program, announced in January 2025. Announced, not spent. Announced is the point. Monuments are always announced at the top of the confidence curve; that's the input to Lawrence's index, not the output.
Now the lag — the part of Lawrence's mechanism that does the damage. These campuses were announced in 2024 through 2026. They open in 2027 through 2030. And the wait has gotten longer than the tower-builders ever faced: in the primary markets, getting a new campus connected to the power grid now takes more than four years (JLL's count). CBRE counted 7,481 megawatts (a megawatt is roughly enough power for several hundred homes) under construction in primary North American markets in the first half of 2026. Every one of those megawatts is a bet placed today on the economy of 2029.
One more contrast, and it's the mom-and-pop heart of it. Meta's giant campus in Richland Parish, Louisiana, expects roughly 5,000 construction workers at peak build — and about 500 permanent jobs when it's done. The Empire State Building at least filled up with tenants, secretaries, rent checks. The new monument employs almost nobody once it opens. Five thousand people build it. Five hundred stay. The rest of the parish gets a substation and a tax argument.
The copper wire runs through all of it
Wilson's newsletter leans on the copper gauge, and on the rule quoted from cycle analyst Phil Anderson: "When copper soars, you can't afford a house." The logic of the old cycle: copper soars when building hits fever pitch late in the land cycle, right before the break.
Copper has soared. It set a record settlement of $6.80 a pound on September 9, 2026, and sits around $6.57 now — up a third off the November 2025 low. But look at what's not soaring: houses. September housing starts ran at a 1.221 million annual pace, with single-family starts at 859,000 — depression-level numbers we've reported on all month. The fever isn't in housing. There is no housing fever.
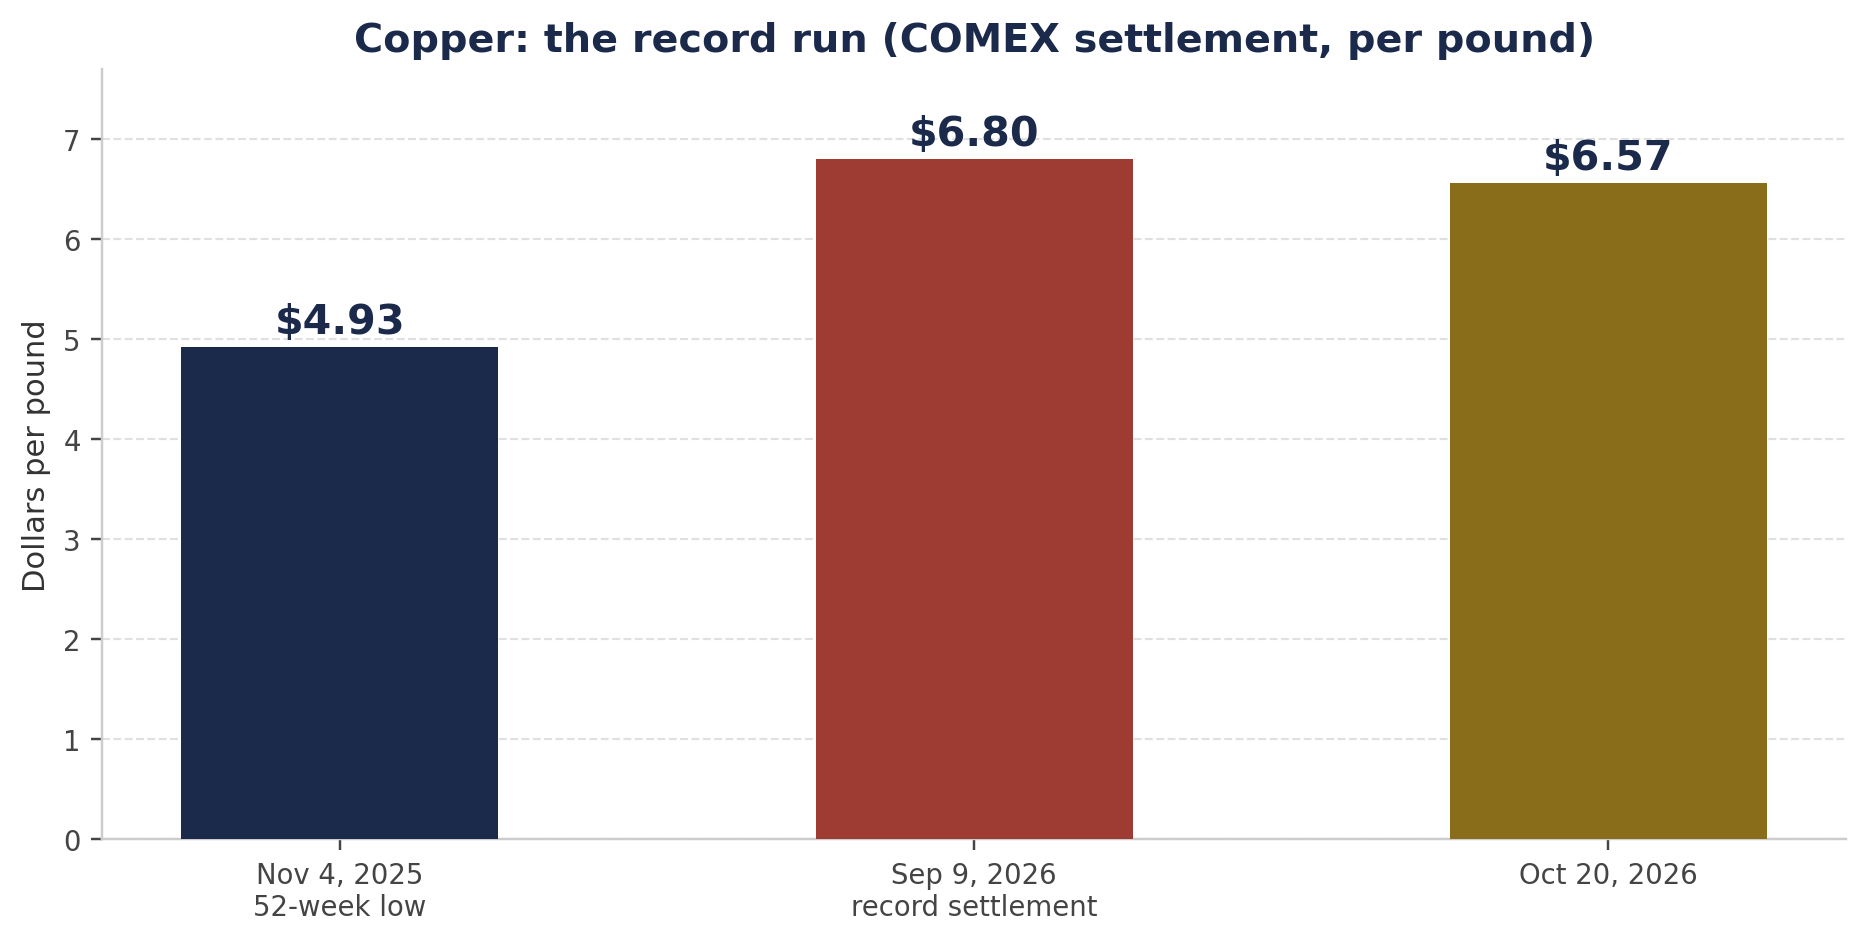
Chart 4 — Copper, COMEX settlement per pound: 52-week low $4.926 (Nov 4, 2025), record settlement $6.8035 (Sep 9, 2026), $6.5665 (Oct 20, 2026). Source: Dow Jones Market Data.
So the old rule is reading a new economy. The demand pulling copper to records isn't houses anymore — it's data centers and the power grid to feed them: busbars, transformers, miles of cable in every campus. And even that signal is part distortion: more than 1.6 million tonnes of copper have been stockpiled in U.S. warehouses, front-running tariffs — hoarding, not consumption. The gauge is real, and the gauge is contaminated. Both at once. That's measurement in 2026: what is created today didn't exist yesterday, and the old ruler measures the old economy.
Copper still matters to operators the practical way — not as a soothsayer, but as a cost. Record copper, record everything that goes into a building, means replacement cost (what it would cost to build the same building new, today) keeps climbing. That is the nominal floor under the buildings that already exist. Your existing roof is worth more because building a new one costs more. That part of the gauge still works, and it works in the owner's favor.
What the index does not say
Discipline, because this is where the newsletter crowd oversells: Lawrence's index is a thermometer, not a clock.
Academics tested it properly — Barr, Mizrach, and Mundra, in Applied Economics (2015). Their finding: building height cannot time recessions. If anything, the causality runs the other way — a growing economy predicts taller buildings better than tall buildings predict a shrinking one. The index tells you two things, and they're worth knowing: confidence and credit are at a peak, and the build lag is long. It does not tell you the month. It does not tell you the year with a straight face. Anyone selling you a date is selling.
So the 80/20 read: the monument evidence says we are late — credit loose, confidence total, commitments enormous, openings scheduled into an unseen economy. It does not say the break is Tuesday. An operator doesn't need the date. An operator needs his house in order before the weather changes, whenever it changes.
The war chest: what mom and pops do with this
Wilson's prescription to his readers is "play defence, build cash, cash is king at the peak." Direction right, specification missing. Cash where? Lines of credit when? Here's our version, in the order that matters — because the sequence is the strategy.
One: pay down debt first. Every dollar of 7–9% debt you kill is a guaranteed return no market promises you. And the payment you free up doesn't disappear — it becomes funding capacity, money that can work when the turn comes. Debt at the top of a cycle is a claim on your future cash flow held by somebody else, priced at the worst moment to be a borrower. Reduce the claims.
Two: open lines of credit now — while the sun shines. Banks lend umbrellas in fair weather and take them back when it rains. A credit line opened at the peak and left untouched costs almost nothing to hold. A line applied for in the panic does not exist — applications get read by frightened people in a contraction. This step has an expiration date, and the date is not printed on it. That asymmetry is the whole reason it's step two and not an afterthought.
Three: keep the war chest in cash value. Properly structured cash-value life insurance — the Infinite Banking idea Nelson Nash spent his life teaching — stores your deployable capital outside the bank-lending system. A policy loan doesn't go in front of a credit committee. No banker can freeze it in a panic because no banker approved it. When the credit contraction comes — and contractions are when lines get cut and monuments get finished into empty economies — the war chest is still there, boring and liquid and yours, ready to deploy when forced sellers start printing clearance prices.
And this is not theory, and it's not a newsletter's opinion. It's the operator's own last cycle: sat out the top, paid down debt, waited with reserves ready — then bought when sellers capitulated and everyone else was anchored to prices that no longer existed. The deals didn't go to the smartest people in 2010. They went to the people whose resources were already in place when the wreckage cleared.
Andrew Lawrence gave us the thermometer in 1999, and the thermometer reads late-cycle: the biggest construction bet in modern history, announced at peak confidence, opening 2027 to 2030 into an economy nobody can see. The monuments don't care whether we're ready. They open on schedule, into whatever shows up.
“Be the one who's ready. Resources ready. Patience intact. The war chest is not a prediction — it's a position.”
Sources
Lawrence, Andrew, "The Skyscraper Index: Faulty Towers!", Property Report, Dresdner Kleinwort Wasserstein Research, January 15, 1999. Thornton, Mark, Mises Institute (2007) — Skyscraper Index model; signal flagged early August 2007. Barr, Jason, Bruce Mizrach & Kusum Mundra, "Skyscraper height and the business cycle: Separating myth from reality," Applied Economics 47(2), 2015 — height does not predict recessions; GDP predicts building height. Hyperscaler capital spending: company Q2 2026 earnings disclosures, guidance compiled as of August 7, 2026 — Big Four (Amazon, Alphabet, Microsoft, Meta) 2025 capex ≈ $410B and 2026 guidance ≈ $725B (+77%); Big Five including Oracle 2025 ≈ $429B and 2026 guidance ≈ $775–800B; company 2026 guidance — Amazon ≈ $220B, Alphabet $195–205B, Microsoft ≈ $175B, Meta $130–145B, Oracle $55.7B; Big-Four Q1 2026 capex $130.65B. Construction: U.S. Census Bureau, Construction Spending (C30), August 2026 release — private data center construction $84.95B SAAR in August 2026 (record; $49.05B August 2025; $36.7B August 2024; $75.2B July 2026), +73% year over year; calendar-year put-in-place $20B (2023), $35B (2024), $50B (2025); data centers 63% of private office construction (47% a year earlier); general office construction $45.8B SAAR, −9.7% year over year; two-year change to August 2026 — data center construction +$48.3B against −$29.2B for new single-family homes and apartments — Census data as reported in trade coverage. Census construction figures cover buildings only and exclude servers and equipment installed inside. Capacity: CBRE, H1 2026 — 7,481 MW under construction in primary North American markets. JLL (2026) — grid connection waits exceed four years in primary markets. Meta — Richland Parish, Louisiana campus: ≈5,000 peak construction workers expected by June 2026; 500+ permanent jobs. Copper: Dow Jones Market Data, COMEX settlements — record settlement $6.8035/lb on September 9, 2026; $6.5665/lb on October 20, 2026; 52-week low $4.926/lb on November 4, 2025; +16.6% year to date. U.S. copper inventories above 1.6 million tonnes including more than 700,000 tonnes in COMEX warehouses (exchange and commercial estimates, October 2026 reporting), accumulated on tariff front-running. Housing starts: U.S. Census Bureau / HUD, September 2026 — total starts 1.221M SAAR, single-family 859K, multifamily 349K. Stargate: $500B program announced January 2025 by OpenAI, SoftBank, and Oracle — an announced commitment, not spending to date. Guidance figures are company-announced plans, not realized spending, and are labeled as guidance wherever used.
Baron Mulberry writes as BlueCollarQuant — blue-collar operator, quant thinking. Real assets, real cycles, no fluff.