Frozen, Not Crashed
A crashed market has forced sellers and falling prices. This market has neither. It has something stranger: no buyers, at depression-level volume.
By Baron Mulberry
A crashed market has forced sellers and falling prices. This market has neither. It has something stranger: no forced selling, no buyers, and volume at depression levels. That's not a crash. That's gridlock.
Nobody's being forced to sell
The shortage of distressed properties is real, and it does keep a floor under prices in the near term. Owners sitting on 3% mortgages aren't moving. Banks aren't dumping inventory. There is no 2008-style wave of defaults forcing hands.
But a market with no forced selling isn't automatically a healthy market. It's a market where the only sellers are the ones who choose to sell — and the buyers have chosen not to show up.
The shortage excuse just broke
For years the industry's fallback explanation was simple: there aren't enough listings. More inventory, the story went, would unlock more sales.
Inventory rose. Sales fell anyway.
The supply of existing homes climbed to 1.62 million units — the highest since November 2019. That translated to 4.9 months of supply, the most in more than a decade. Those are the industry's own reported figures. And transactions kept falling: existing home sales ran at 3.93 million annualized in August and 3.99 million in September — two readings that flirt with the bottom of the last major housing bust fifteen years ago.
If listings were the obstacle, more listings should have meant more sales. They didn't. The shortage explanation is weakening in real time.
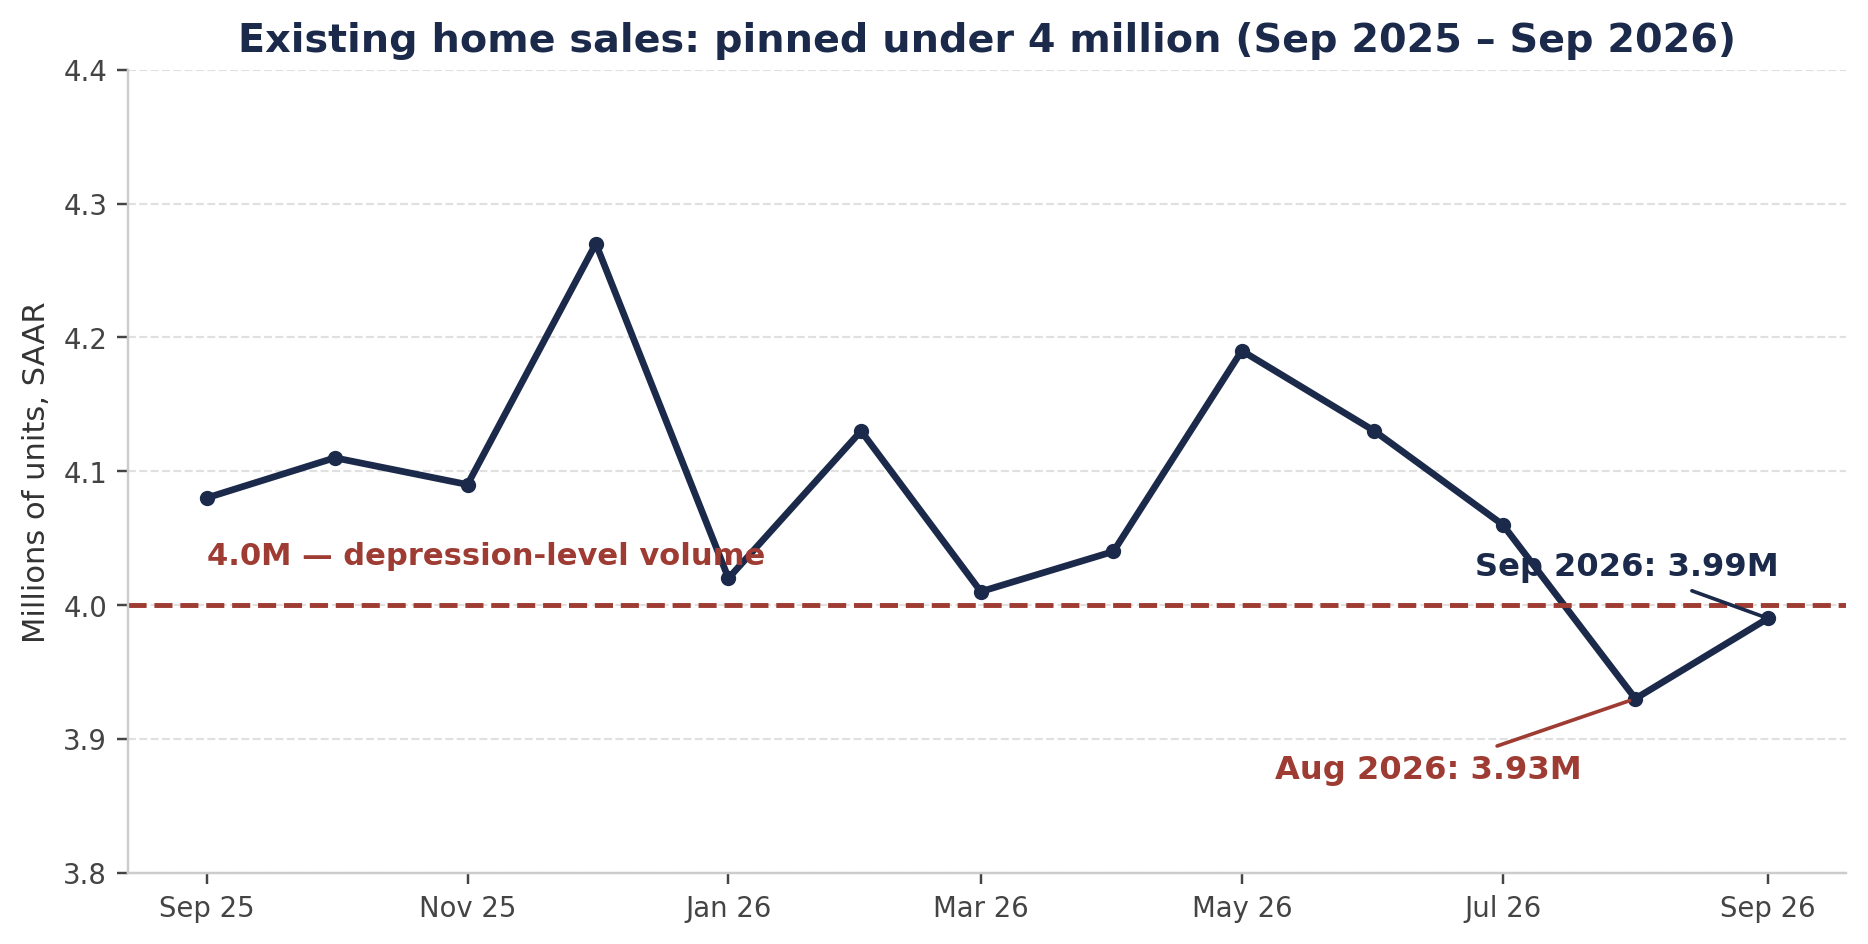
Chart 1 — Existing-home sales, seasonally adjusted annual rate, September 2025 to September 2026 (the full window in the verified FRED file): August 2026, 3.93M; September 2026, 3.99M. Inventory of 1.62M units and 4.9 months' supply are NAR-reported figures via the source transcript — attributed in the text, not plotted as a series. Source: FRED (EXHOSLUSM495S).
Gridlock at depression volumes
What you get when prices stay sticky and volume collapses is a market that isn't functioning — it's frozen. Sellers list at 2022 anchors. Buyers strike. A handful of transactions clear at the margins. Everyone else waits.
And the wait is directional. Pending home sales just printed 66.0 — the lowest since the index began in 2001. Pending contracts lead completed closings by weeks, so the fourth quarter's closed sales are heading lower from an already depressed level. The housing depression isn't ending. It's entering another leg down.
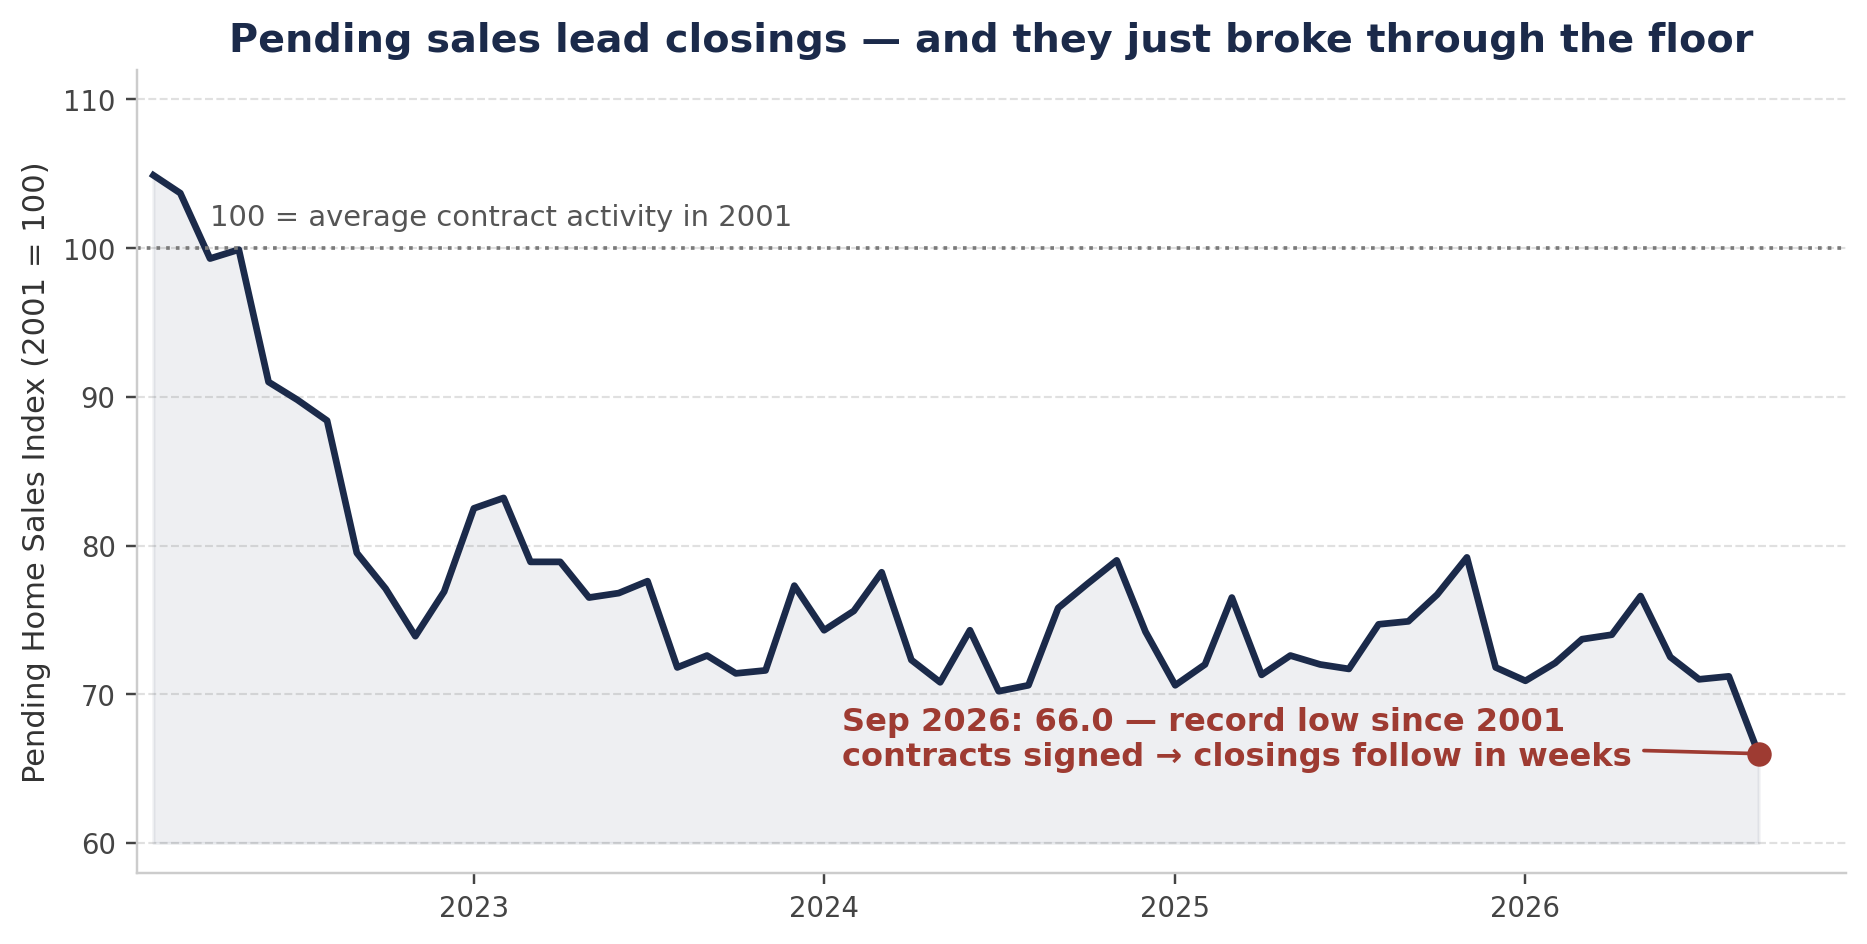
Chart 2 — NAR Pending Home Sales Index, monthly, seasonally adjusted (2001 = 100), as reported at each release. September 2026: 66.0, the lowest since the series began in 2001. Sources: NAR September 2026 release; monthly history as tabulated from NAR releases.
This is the distinction that matters for anyone who operates instead of opines: a frozen market is not a market waiting for one good headline. It's a market where the adjustment happens through price and time — one seller cutting, one listing aging, one anchor dragging — until the general population accepts the new reality.
The operator read
Your local tape already rhymes with the national one: Lakeland — 907 active listings, 63 days on market, 24% of sellers cutting prices. The capitulation is underway; it's just happening in slow motion, one price cut at a time.
Frozen markets are where discipline gets paid. Don't chase volume that isn't there. Don't underwrite a thaw. Keep resources ready — cash, credit lines, labor — and buy the sellers who finally re-anchor. The 2010 playbook worked because the market was frozen then too. Fear froze it in 2010. Strike froze it now. The adjustment is the same trade: price, not rates.
Sources
Existing home sales 3.93M (Aug) / 3.99M (Sep) annualized — verified against FRED series EXHOSLUSM495S (CSV downloaded Oct 20, 2026; file window Sep 2025–Sep 2026). Inventory 1.62M units (highest since Nov 2019), 4.9 months' supply (most in a decade) — NAR-reported figures via the source transcript (Oct 20, 2026). Pending home sales 66.0 — NAR September 2026 release (reported in the Tuesday tape addendum, Oct 20, 2026). Lakeland figures (907 active, 63 days, 24% cutting) — Tuesday tape decoder (Oct 19–20, 2026).