Builders See It First
Builders don't read the economy in reports. They read it in traffic — how many people walk through the model home on a Saturday. Right now, they're reading it in an empty parking lot.
By Baron Mulberry
The number that matters
The National Association of Home Builders' confidence index fell three points in October to 29 — the lowest since June 2012. Anything under 50 means more builders rate conditions poor than good. This index hasn't seen 50 in more than two years. Now it's deteriorating further.
The components tell you it's not one bad line:
- Current sales conditions: 33 — also a 14-year low
- Expected sales, next six months: weakest since November 2022
- Prospective buyer traffic: lowest since the onset of the pandemic Three angles — now, later, and who's actually walking in — and all three point down. This isn't pessimism about one thing. It's broad-based.
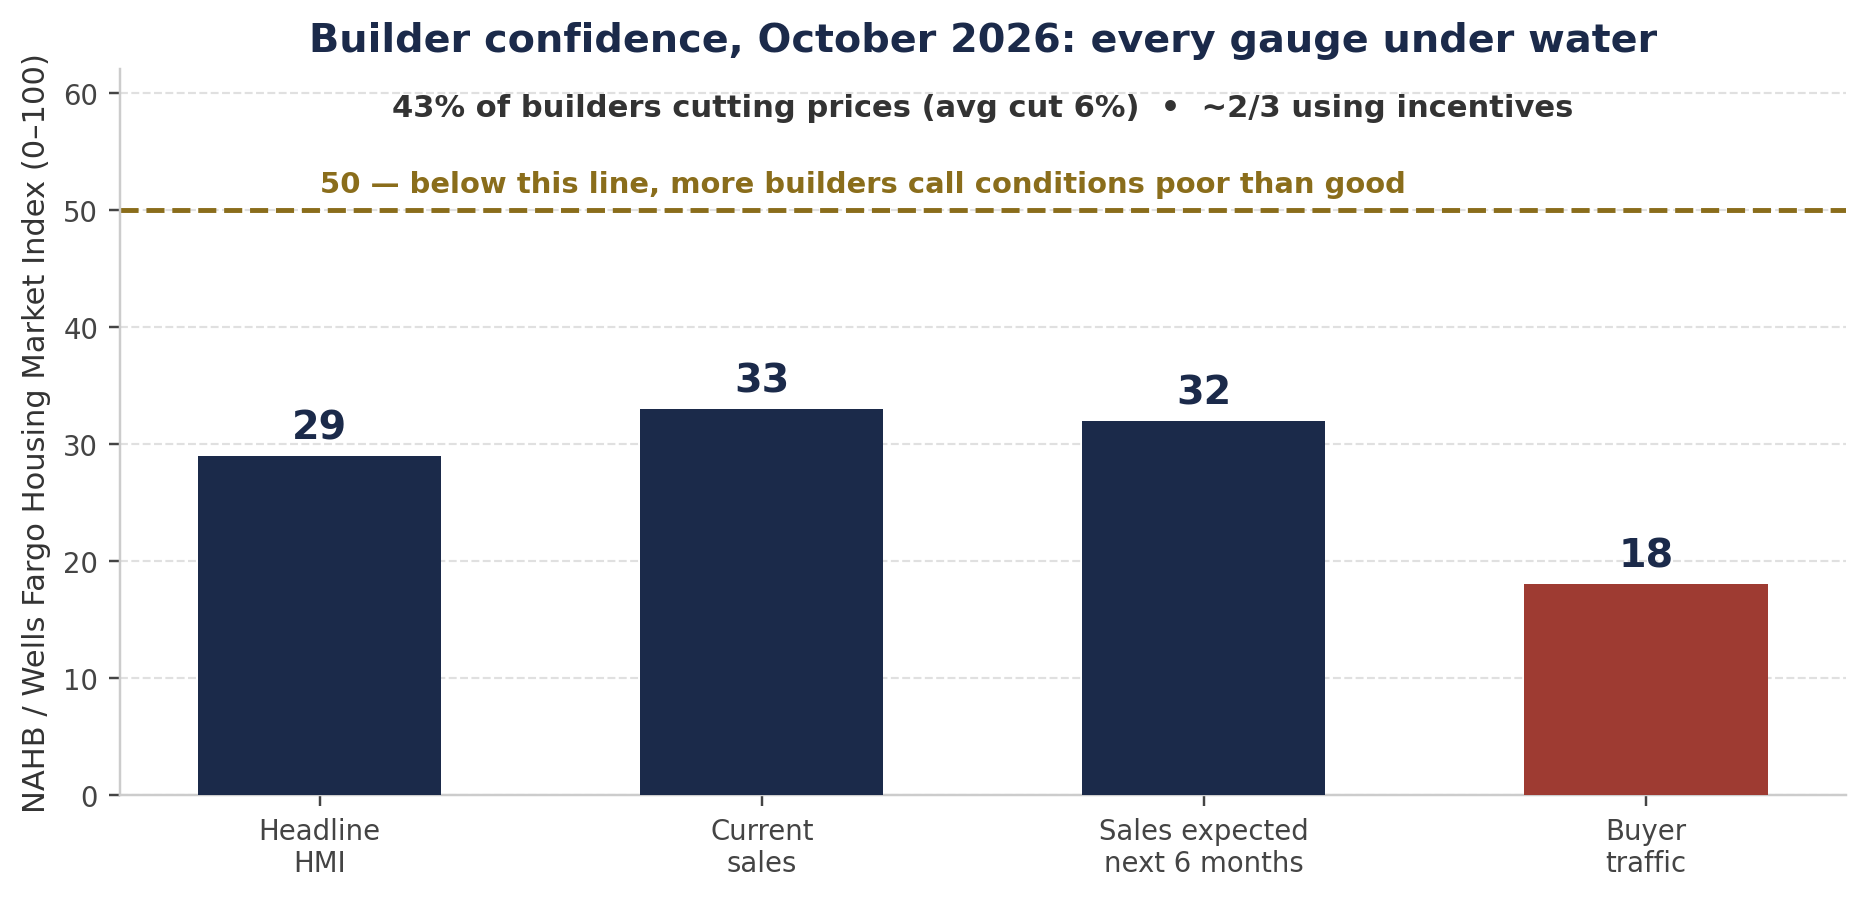
Chart 1 — NAHB / Wells Fargo Housing Market Index, October 2026: headline 29, current sales 33, expected sales 32, buyer traffic 18, with 43% of builders cutting prices and roughly two-thirds using incentives. Single-month readings from the NAHB release of October 19, 2026. Source: NAHB.
Discounts that don't work
When builders can't get traffic, they do the only thing they can: cut.
43% of builders are cutting prices — the average cut is 6%. Roughly two-thirds are offering incentives: rate buydowns, closing-cost help, upgrades — concessions that lower the effective price without lowering the sticker price as dramatically.
And here's the tell: traffic is still disappearing.
If demand were strong but merely rate-constrained — people who want to buy, just waiting on a cheaper payment — then discounts should release that demand. Cut the price, throw in a buydown, and the buyers flood in. That's the theory.
It's not happening. Builders are cutting, discounting, and waiting, while their confidence sits at levels last seen in the aftermath of the previous housing crash. You can't incentivize someone into the largest financial commitment of their life when they don't trust the paycheck that carries it.
Permits are tomorrow's starts
A housing start tells you what builders are doing today. A permit tells you what they believe about tomorrow.
Builders don't apply for permits, buy materials, grade land, and line up subcontractors unless they believe completed homes can eventually be sold at acceptable prices. So watch the permit line — it's a vote on future demand.
Single-family permits fell to 845K in September — the lowest since March 2023. Verified in the data, not in anyone's opinion. Builders are voting that weakness extends beyond September. And remember, residential construction feeds manufacturing, transportation, appliances, furniture, and the trades — contractors, electricians, plumbers, roofers, equipment operators. When builders pull back, the goods economy and the labor market feel it. Which feeds back into the very confidence problem that started it.
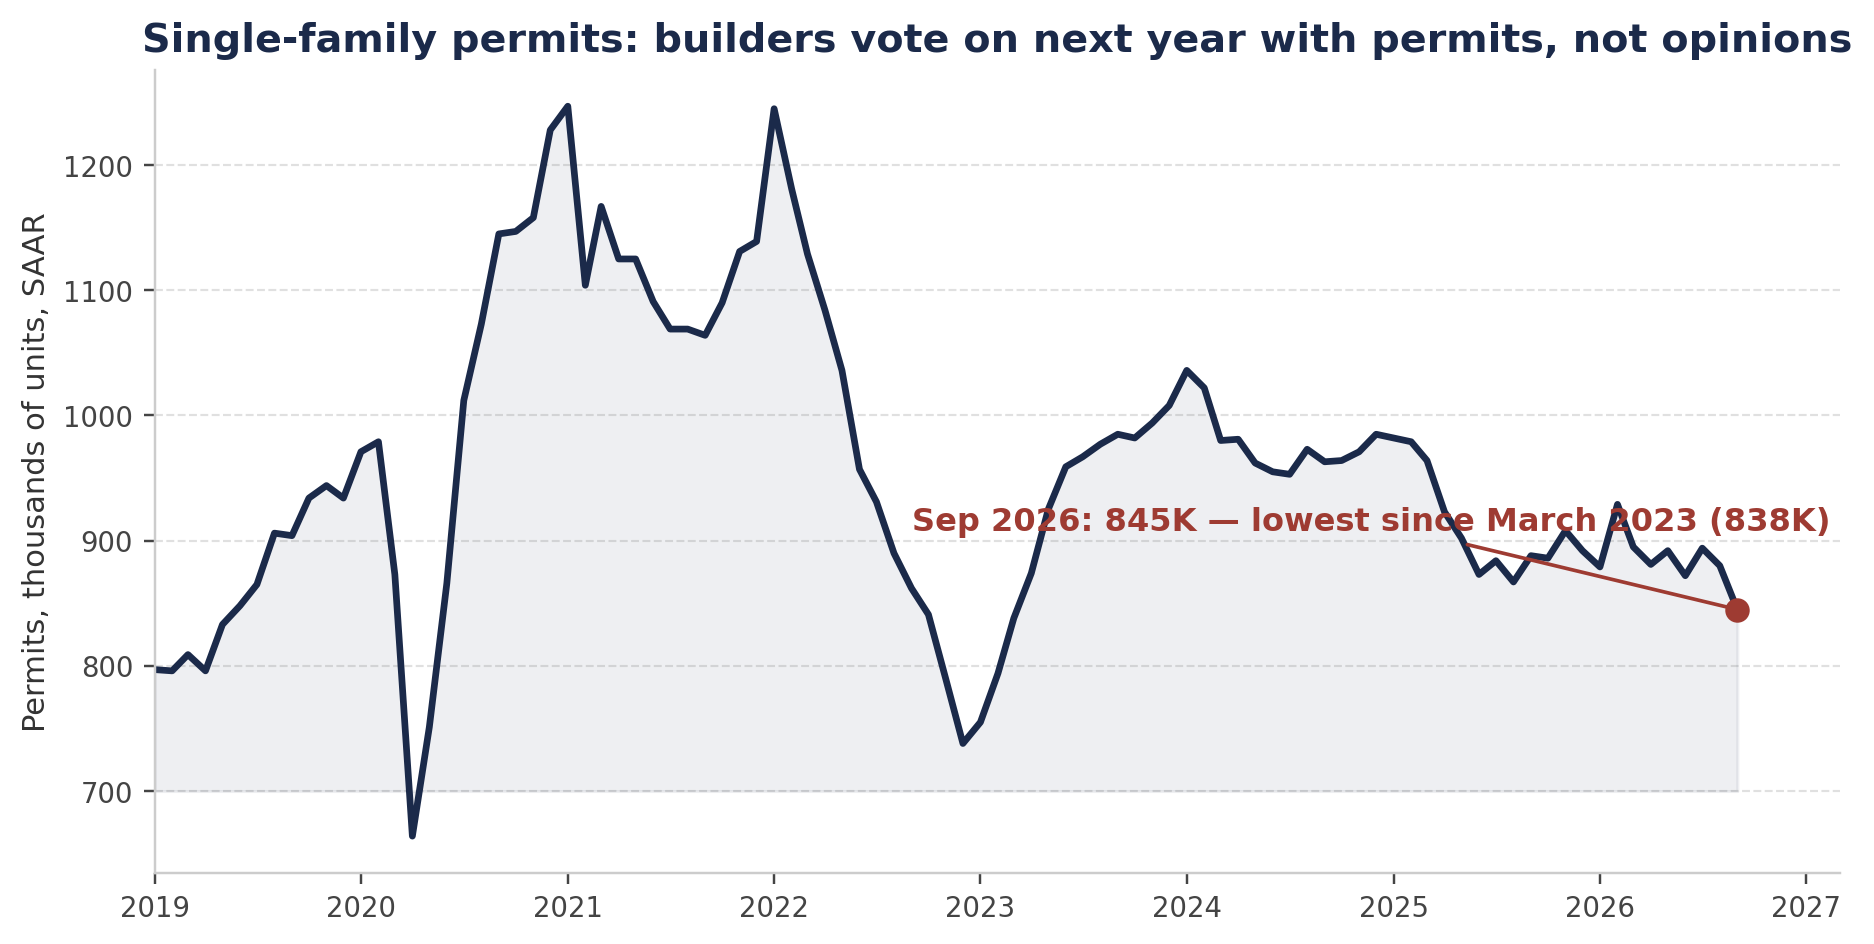
Chart 2 — Single-family building permits, monthly, seasonally adjusted annual rate, 2019 to September 2026. September 2026: 845K, the lowest since March 2023 (838K). Source: U.S. Census Bureau / HUD via FRED (PERMIT1).
One honest split worth keeping, because it's your standing line: South starts rose 6.1% to 714K — your market is still building while the West froze (-23%). Single-family feeds the buy box; multifamily feeds future rental supply. Track both, trade neither month's noise.
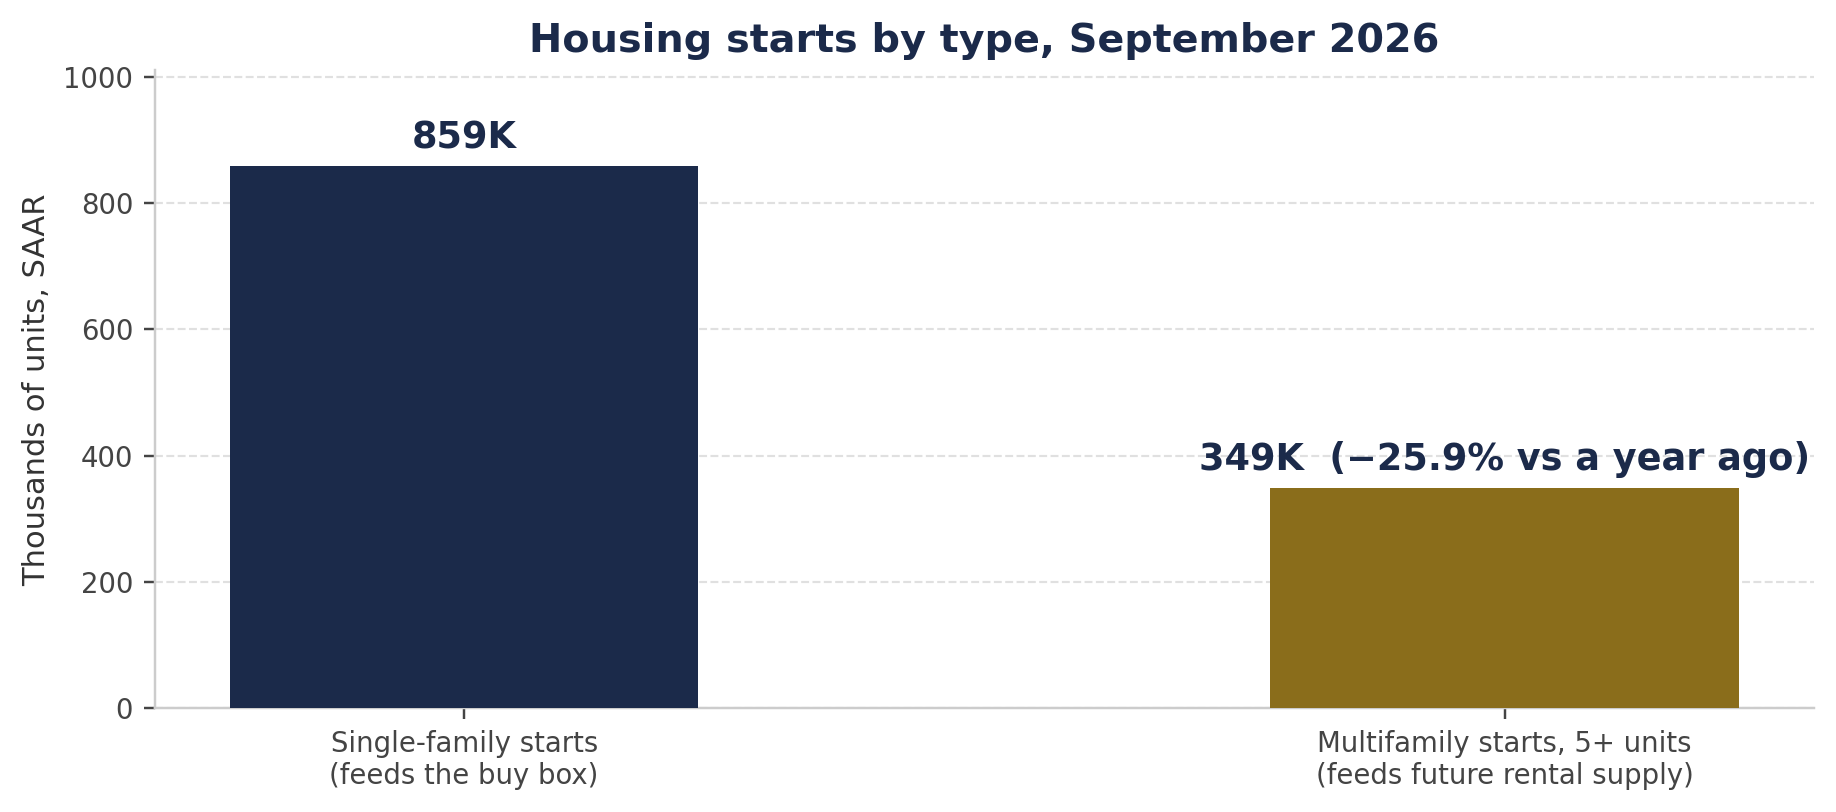
Chart 3 — Housing starts by type, September 2026: single-family 859K; multifamily (5+ units) 349K, down 25.9% from a year ago. Source: U.S. Census Bureau / HUD via FRED (HOUST1F, HOUST5F).
The operator read
Don't wait for builder confidence to recover before you act. Builder confidence is the last thing that recovers — it turns when traffic turns, and traffic turns when households believe in their paychecks again.
What you watch instead: the price cuts getting deeper, the incentives getting louder, and the permit line telling you builders have stopped betting on next year. That's the capitulation sequence. Your job is the same as it was in 2010: resources ready, patience intact, buy when their anchor is wrong.
Sources
NAHB/Wells Fargo Housing Market Index, October 2026 release (nahb.org, Oct 19, 2026) — headline 29, current sales 33, expected sales weakest since Nov 2022, traffic lowest since pandemic onset, 43% cutting prices (avg 6%), ~two-thirds using incentives, as reported in the source transcript. Single-family permits 845K Sep 2026, lowest since March 2023 — verified against FRED series PERMIT1 (CSV downloaded Oct 20, 2026; prior low 838K in Mar 2023). South starts +6.1% to 714K — Tuesday tape (Oct 20, 2026). Starts by type — FRED HOUST1F / HOUST5F, September 2026.