Housing Is Not a Rates Story
By Baron Mulberry
Pending home sales just fell to the lowest level ever recorded.
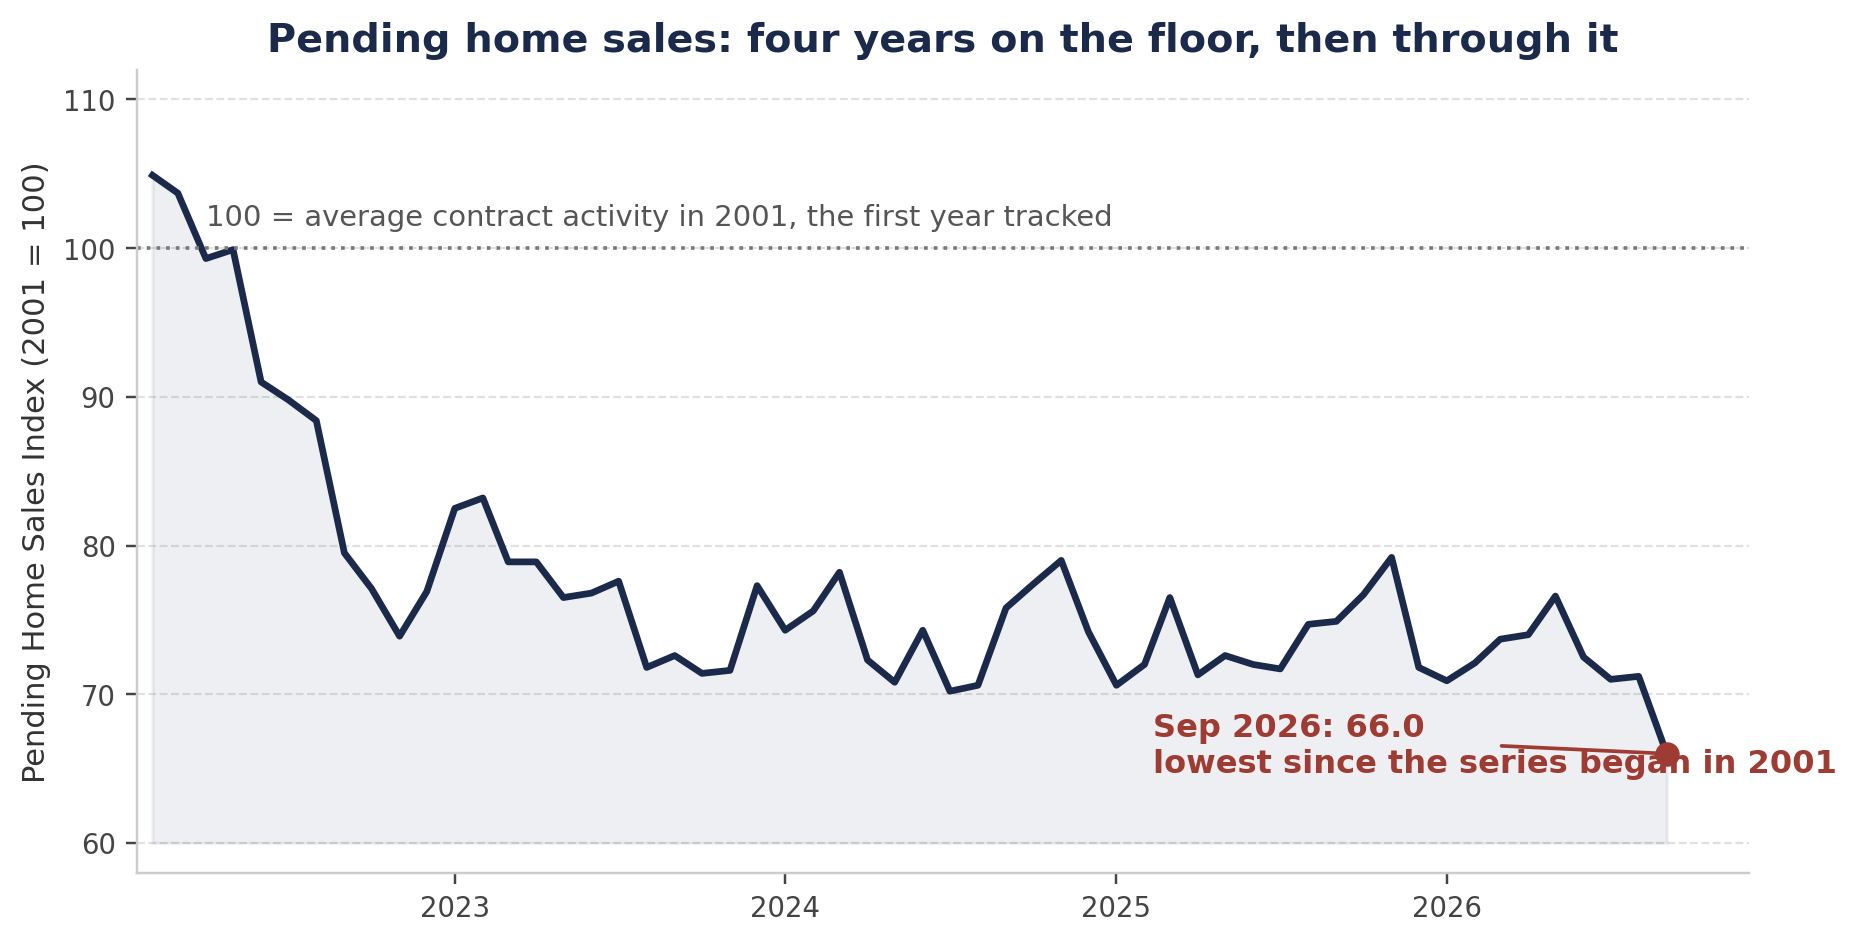
Not the lowest since rates went above 7%. Not the lowest since the pandemic. The lowest since the National Association of Realtors (NAR) started tracking contract signings in 2001 — lower than 2008, lower than the lockdowns. The index dropped 7.3% in September to 66.0, down 11.3% from a year ago, against a forecast of almost no change at all.
NAR’s chief economist, Lawrence Yun, blamed “fast-rising mortgage rates.” He is not wrong that rates hurt. He is wrong that rates are the story.
A mortgage is not a bet on next month’s interest rate. It is a bet that you will still have the income — still have the job — in year five, year ten, year twenty. American households are not refusing to sign because of a number on a rate sheet. They are refusing to sign because they do not trust the paycheck underneath the payment. And when you line the gauges up side by side — contracts, builder confidence, permits, hiring — every single one of them says the same thing, in its own numbers.
“Rates set the payment. The labor market decides whether a family believes it can make that payment for 30 years.”
The lowest number since they started counting
Pending sales count contracts signed on existing homes. Those contracts usually close a month or two later, so the index is the housing market’s forward gear: it tells you where completed sales are going before they get there. September’s 66.0 says closings are heading lower — from a base that was already on the floor. Existing-home sales ran at a 3.99 million annual pace in September and 3.93 million in August. By NAR’s own account, August and September were the two slowest months for home sales this year.
This was not one region wobbling. Contracts fell in all four regions in September: the West dropped 9.2% to 49.3, the South fell 8.2% to 79.2, the Midwest fell 6.5% to 67.3, and the Northeast fell 4.2% to 59.0. When every region falls together, the cause is not local. It is national, and it sits upstream of housing.
Look at the shape of the series, because the shape is the argument. The index collapsed in 2022, then spent four years grinding along the floor in the 70s — and in September it broke down through that floor to a level never printed before, not during a financial crisis and not during a government-ordered shutdown of the economy. There is no lockdown today. There is no 2008-style wave of defaults. There are just fewer signed contracts than during either disaster.
If it were the rate, the dips would have fixed it
The rates-only story makes a testable prediction: when rates fall, buyers come back. We have run that test, more than once, inside this same housing slump — and it failed.
In February of this year, the 30-year fixed mortgage averaged 6.05%. That is 135 basis points — more than a full percentage point — below the 7.40% Freddie Mac printed last week. If the rate were the binding constraint, February should have looked like a release valve. It did not. Existing-home sales ran at 4.13 million that month, still pinned to the same 4 million line they cannot escape, and the pending index sat at 72.1 — on the same floor it has occupied since 2022. Cheaper money came and went. The buyers did not move.
None of this says the payment does not matter. Run it at the kitchen table: at September’s median existing-home price of $417,500, a buyer with 20% down owes roughly $2,313 a month in principal and interest at 7.40%, versus about $2,061 at the 6.27% rate of a year ago. That $252 a month is real money to a real family — more than $3,000 a year. But $252 a month does not produce the lowest contract count in a quarter-century of records. Fear of losing the entire paycheck does.
That is the piece the rate story always leaves out. Affordability is not one number; it is a relationship between price, payment and income — and the term doing the damage is the third one. A household that trusts its income will stretch for the payment and refinance when it can. A household that does not trust its income will not sign a 30-year commitment at almost any rate you offer it.
A mortgage is a bet on a paycheck
So look at the labor market the way a homebuyer feels it — not the headline, the moving parts. The Job Openings and Labor Turnover Survey (JOLTS) for August: job openings fell by 256,000, to 7.08 million. Hiring — the part of JOLTS that actually puts people to work — was 5.19 million, essentially unchanged from July’s 5.15 million, stuck at the same depressed level it has been marking time at. And the quits rate sat at 1.9%.
Translate those three numbers into plain English. Openings are the help-wanted signs in the window; hiring is whether anybody is actually getting hired — and it is frozen. Quits are the confidence of people who already have jobs: workers quit when they can see something better across the street. At 1.9%, they are staying exactly where they are, because from where they sit, there is nothing better to quit to.
Here is what matters for housing: a family does not need to be unemployed to turn defensive. It needs to hear that the company is cutting costs. That orders are slowing. That the coworker who left is not being replaced. That a friend has been searching for four months. People respond to that long before it shows up in an unemployment rate — they delay the truck, they pull back the card, and they absolutely do not sign the largest contract of their lives. The pending index is that defensiveness, measured: 66.0.
The builders are staring at the same empty room
If you think buyers are merely rate-blocked, the builders should be able to unblock them — they have discounts, incentives and rate buydowns, which are just mortgage-rate cuts the builder pays for. October’s builder survey is what that experiment looks like when it fails.
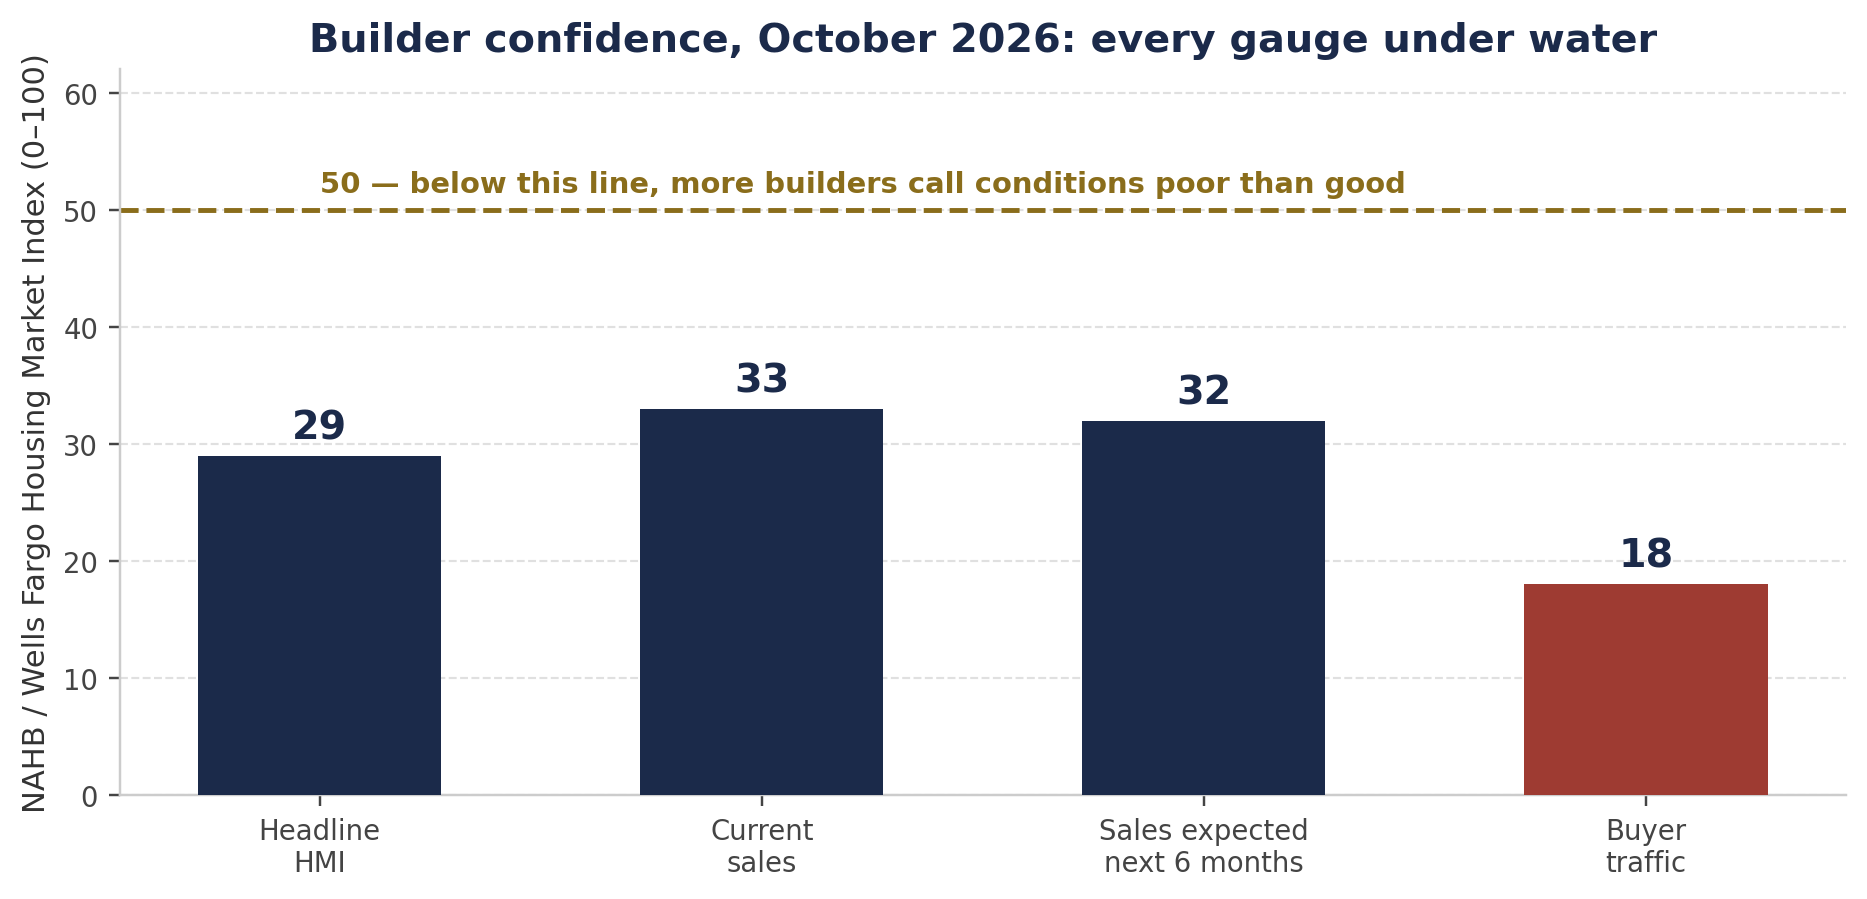
The National Association of Home Builders (NAHB) / Wells Fargo Housing Market Index fell three points in October to 29 — its lowest reading since June 2012, in the wreckage after the last housing crash — and it has now sat below 40 for 18 consecutive months. Anything under 50 means more builders call conditions poor than good. Every component is under water: current sales at 33, a 14-year low; sales expected over the next six months at 32; and traffic of prospective buyers at 18, the lowest since April 2012 apart from the single pandemic-shutdown month of April 2020.
Now the part that breaks the rates story. In October, 43% of builders cut prices — the highest share in the 2020–2026 survey period — with the average cut holding at 6%. And 65% of builders were using sales incentives, the 19th straight month that share has run at 60% or more. Price cuts, incentives, buydowns: the full toolkit, deployed at the widest scale in years. Buyer traffic still printed 18. When a seller cuts the price, subsidizes the rate and throws in the upgrades, and the customer still does not walk through the door, the problem was never only the price or the rate. The customer is not coming.
Starts and permits: builders voting on next year
Builders do not just talk in surveys; they vote with money. A housing start is money spent today. A building permit is money committed to a future the builder has to believe in. September’s Census Bureau numbers show both votes going the same way.
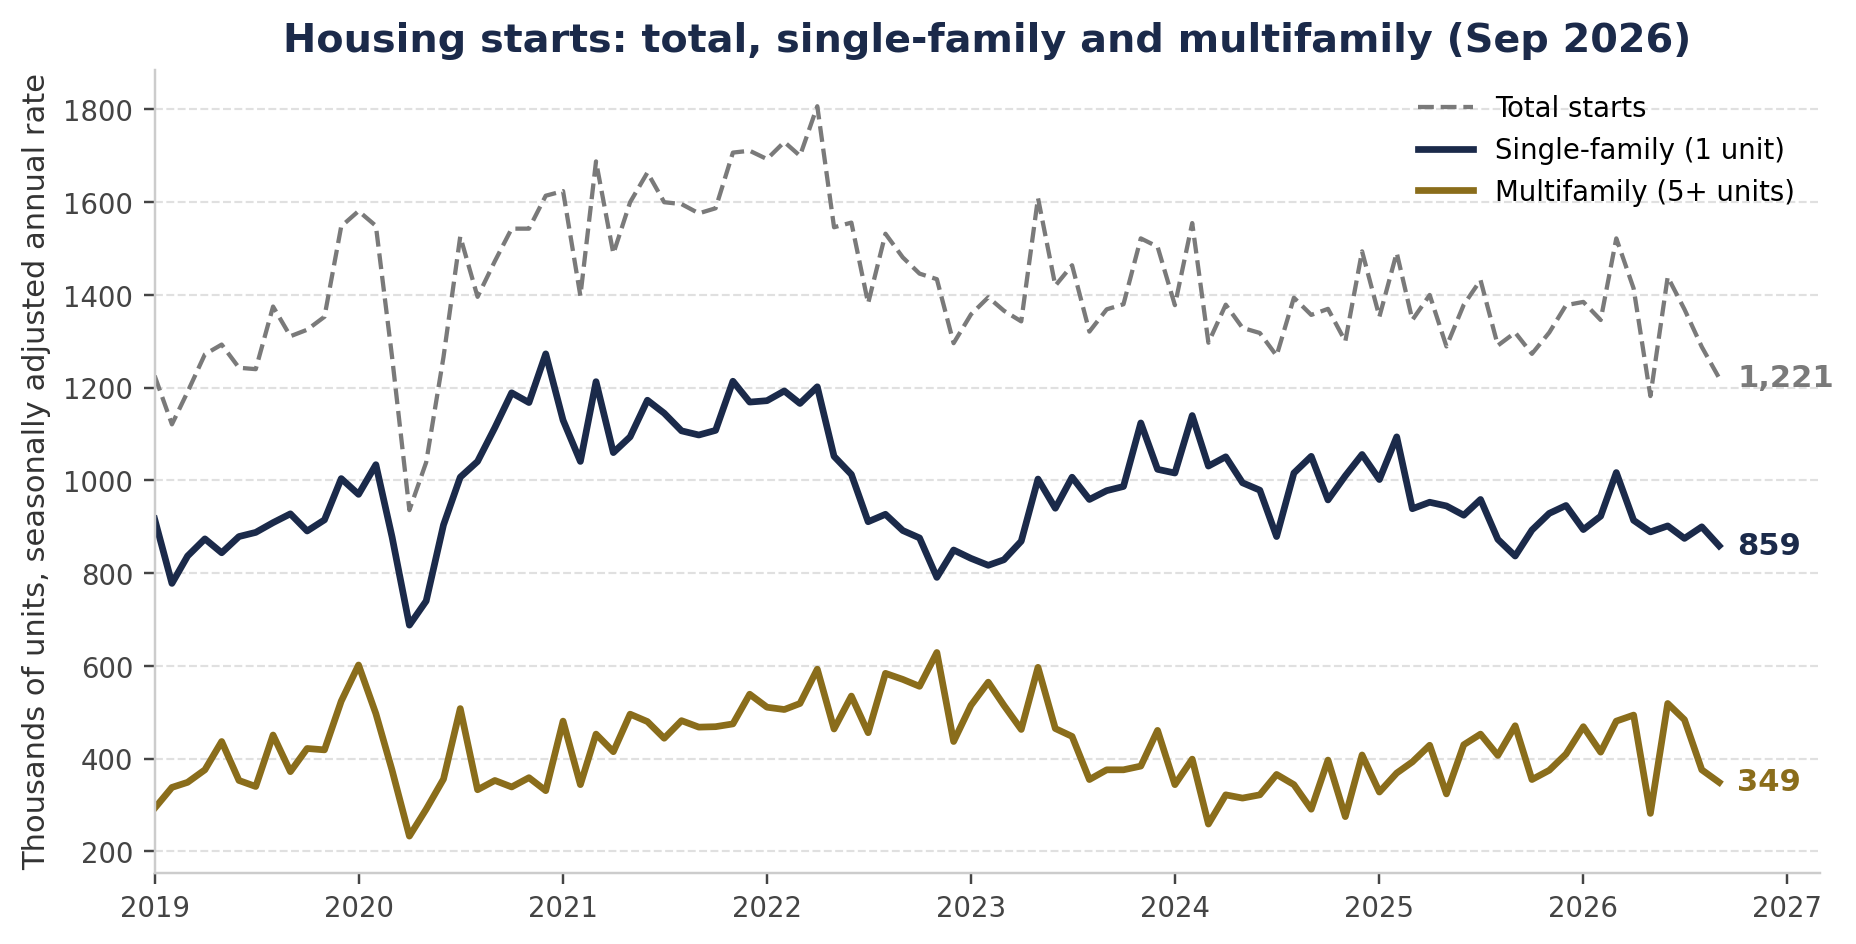
Total housing starts fell 5.2% in September to a 1.221 million annual rate, 7.4% below a year ago — the second-weakest pace since May 2020. Single-family starts fell 4.6% to 859,000, the lowest since September 2025. Multifamily starts in buildings of five units or more fell 7.2% to 349,000, down 25.9% from a year ago. Permits told the forward-looking version of the same story: total permits were nearly flat at 1.400 million, but single-family permits fell 4.0% to 845,000 — the lowest since March 2023. Builders are not just building less now; they are lining up less to build next.
Read the split the way an operator reads it, because the two lines do different work. Single-family is the buy-box line: houses that compete with the resale market and, at the margin, with rentals. Soft single-family permits today mean thin new supply tomorrow. Multifamily is the rental-supply line: apartment buildings started today are the units delivering into rental markets in 2027 and 2028, competing for the same tenant dollars as every rental operator. Multifamily starts down 25.9% on the year means that future supply wave is shrinking — a slow tailwind for rents that arrives building by building, not all at once.
One honest caution, because the data deserves it: the Census Bureau puts a margin of error of about ±11.8 points around a single month’s change in starts, so one month proves little by itself. That is exactly why you read starts together with permits, traffic and signed contracts — and right now all four are pointing down at the same time.
Frozen is not the same as healthy
The industry’s comfort blanket is the shortage story: there are too few homes, distress is low, so prices will hold and the market is basically fine. September’s numbers test that story too — and it fails the same way.
Distressed sales were just 2% of transactions in September. That part is true, and it is exactly why prices are sticky: almost nobody is forced to sell. The median existing-home price was $417,500, up 1.3% from a year ago — the 39th consecutive month of year-over-year price gains. Prices are not falling. Transactions are disappearing. Those are different statements, and a market can do both at once: it just stops being a market and becomes a standoff.
And the shortage excuse no longer fits its own data. Inventory rose to 1.60 million homes, up 4.6% from a year ago, equal to 4.8 months of supply versus 4.5 months last September. If a lack of listings were the main obstacle, more listings should have produced more sales. Instead sales fell 2.2% from a year ago while the shelf got fuller — and homes sat longer doing it, a median of 33 days on the market, up from 31 in August. Owners locked into 3% mortgages still are not listing into a 7.40% world, buyers who do not trust their income are not buying what is listed, and builders are cutting prices into the gap. That is not health. That is gridlock at depression-level volume.
“Low distress does not make a market healthy. It makes it frozen.”
Housing doesn’t just react. It amplifies.
Here is the loop nobody puts in the rate headline, and it is the reason this matters beyond real estate. Weak confidence in jobs cuts home purchases — contracts at 66.0. Fewer purchases make builders pull back — starts at 1.221 million and single-family permits at 845,000, a three-and-a-half-year low. And a construction pullback lands directly on blue-collar paychecks: completions already ran 14.0% below a year ago in September, at a 1.192 million pace. Residential construction is work for contractors, electricians, plumbers, roofers, equipment operators, truck drivers and the lumber yard behind all of them. Cut that work and you cut exactly the incomes that the next round of buyers was supposed to come from.
So housing is not simply a mirror of the economy. It is a machine that can make a weak economy weaker: confidence falls, building falls, paychecks fall, confidence falls further. Every turn of that loop is visible in a number printed this month.
The official story keeps confessing a year later
There is a pattern running under all of this, and once you see it you cannot unsee it: households report the economy as it feels, officials dismiss the feeling, and then the official numbers get revised until they agree with the households.
It happened with spending. Benchmark revisions cut roughly 5% off the estimated level of retail sales going back to 2022 — spending that was reported, celebrated as proof of a resilient consumer, and then quietly un-happened. It happened with jobs: benchmark revisions to the 2024 and 2025 payroll data erased large amounts of the job growth that had been reported month by month. And it is still happening in miniature, in this very housing data: August’s existing-home sales were first reported at 3.98 million and have already been revised down to 3.93 million.
For years the consumer surveys said the economy felt bad and the experts called it a “vibecession,” because the hard data said otherwise. Then the hard data changed — hard. The lesson for housing is direct: when an industry economist quotes first-print job growth and first-print income as proof that willing buyers exist, he is building on numbers with a documented habit of shrinking. The revised data said those buyers were never there. September’s record-low contract count says they still are not.
What an operator does with this
So do not underwrite a rate rescue. If mortgage rates fall from here, ask why they are falling. Rates usually decline because markets expect slower growth and weaker inflation — because the bond market sees the same labor softness the housing data is screaming about. A payment that gets $200 cheaper while the buyer’s confidence in keeping his job gets worse is not a housing recovery; it is the same market with a smaller number attached. September gave us the proof in one print: rates at 7.40%, contracts at 66.0, traffic at 18.
The adjustment, as ever, comes through price and time. Builders are already doing it in public — 43% cutting, an average of 6% at a time. Resale sellers will do it the way they always do: slowly, listing by listing, until “what my house is worth” becomes “what clears.” The operator’s job is not to predict the month it happens. It is to keep resources ready — reserves, low leverage, capacity — and to watch the gauges that will actually turn first.
Here is the dashboard, with this month’s prints on it. Pending contracts: 66.0. Builder traffic: 18. Single-family permits: 845,000. Builders cutting prices: 43%. When traffic and permits turn up together, the turn is real, and the story changes. Until they do, every one of those numbers says the same thing the kitchen tables of this country have been saying for years: it was never just the rate.
“We love narrative but the data makes it empirical.” — the BlueCollarQuant working principle: the story carries it, the data proves it.
Baron Mulberry writes as BlueCollarQuant — blue-collar operator, quant thinking. Real assets, real cycles, no fluff.
Sources and data notes
Every figure in this article comes from the releases below, retrieved October 20–21, 2026. Charts plot those series directly; no number in the text is carried without its source.
- Pending home sales, September 2026 (NAR, released Oct 20, 2026) — Reuters
- Pending home sales, September 2026 — HousingWire
- Pending index monthly history (NAR data as tabulated) — Mortgage News Daily
- Builder confidence, October 2026 (NAHB / Wells Fargo HMI) — NAHB
- Builder sentiment release, October 2026 — NAHB
- New residential construction, September 2026 (Census / HUD) — release summary
- Existing-home sales, September 2026 (NAR) — Realtor.com Research
Chart and text series from the Federal Reserve Bank of St. Louis (FRED): housing starts HOUST, single-family starts HOUST1F, multifamily starts HOUST5F, single-family permits PERMIT1, 30-year mortgage rate MORTGAGE30US (Freddie Mac), existing-home sales EXHOSLUSM495S, job openings JTSJOL, hires JTSHIL, quits rate JTSQUR (BLS JOLTS, August 2026).
Data notes: (1) FRED’s downloadable file for the pending home sales index (PHSUSSA) was unavailable at build time, so Chart 1 plots NAR’s index values as reported at each monthly release, cross-checked across two independent publishers; small differences of a few tenths between data vintages are normal for this series. (2) The September pending release reported August’s index as 71.2 (+0.3% on the month, July revised to 71.0); the chart uses those release values. (3) The retail-sales figure (“roughly 5% off the estimated level back to 2022”) and the characterization of the 2024–2025 payroll benchmark revisions follow the benchmark-revision reporting in the source material for this piece. (4) The Census Bureau reports a ±11.8 percentage-point margin of error (90% confidence) around the monthly change in total housing starts; the article reads starts together with permits, builder traffic and contract signings for that reason.