Forty-Two Percent of Almost Nothing
By Baron Mulberry
You've seen the poster. Red BREAKING NEWS banner, a map lit up like an emergency, and the headline in letters big enough to read from the sidewalk: US HOME FORECLOSURES SURGE 42% AS BANKS TAKE BACK MORE HOMES. Underneath, state foreclosure starts up 145%, 102%, 69%.
Before you feel anything about that poster, do what operators do first. Don't ask how big the percent is. Ask what it's a percent of.
The 42% is the smallest number on the page
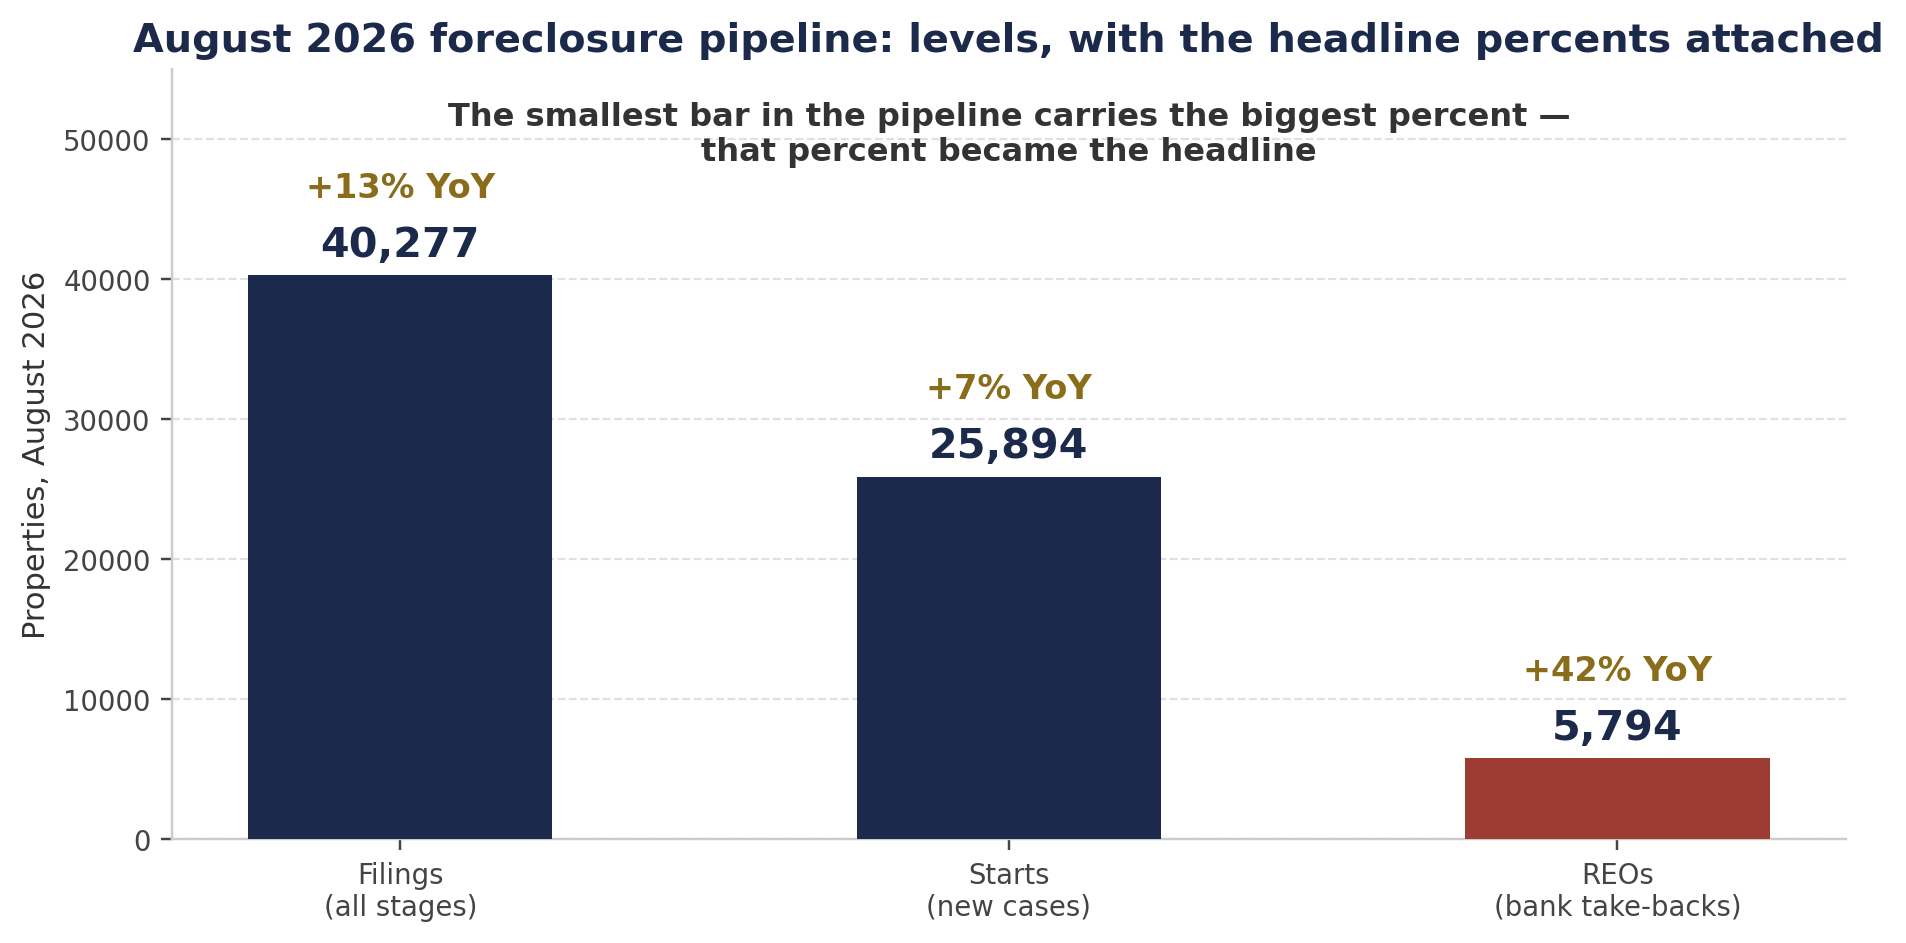
Foreclosure is a pipeline with three stages, and ATTOM reported all three for August 2026:
- Filings: 40,277 properties — up 13% from a year ago
- Starts: 25,894 — lenders opening new cases, up just 7%
- REOs: 5,794 — completed foreclosures, banks actually taking houses back, up 42%
The headline took the third number. The smallest count in the pipeline, with the biggest percent attached to it. That's not an accident. That's marketing.
5,794 bank take-backs in a country of roughly 144 million housing units. One property in every 3,569 had any foreclosure filing at all in August. Starts — the front door of the pipeline, the number that tells you whether a new wave is forming — rose 7% year over year and actually fell 3% from July. The front door is quiet. The poster doesn't mention that. The poster never mentions that.
Percentages off a frozen floor lie by construction
Here's the part nobody puts on the graphic: the base.
In 2020 and 2021, foreclosure in America was effectively switched off. Federal moratoria, state bans, forbearance programs — the machinery was frozen by policy, on purpose. Foreclosure activity fell to the lowest levels ever recorded. Not low for a cycle. Low for the history of the data.
Any honest count measured off a frozen floor prints scary numbers. Double a near-zero and you get a headline. ATTOM's own annual report frames it plainly: foreclosure starts in 2025 were up 213% from the pandemic-era low of 2021 — triple-digit surge, same as the poster — and still 14% below 2019.
Both of those sentences are true. Only one of them fits on a poster.
"A percent is not a level. A percent off a frozen floor is marketing squared."
The ladder: levels, not vibes
Put the levels in a row and the story changes completely.
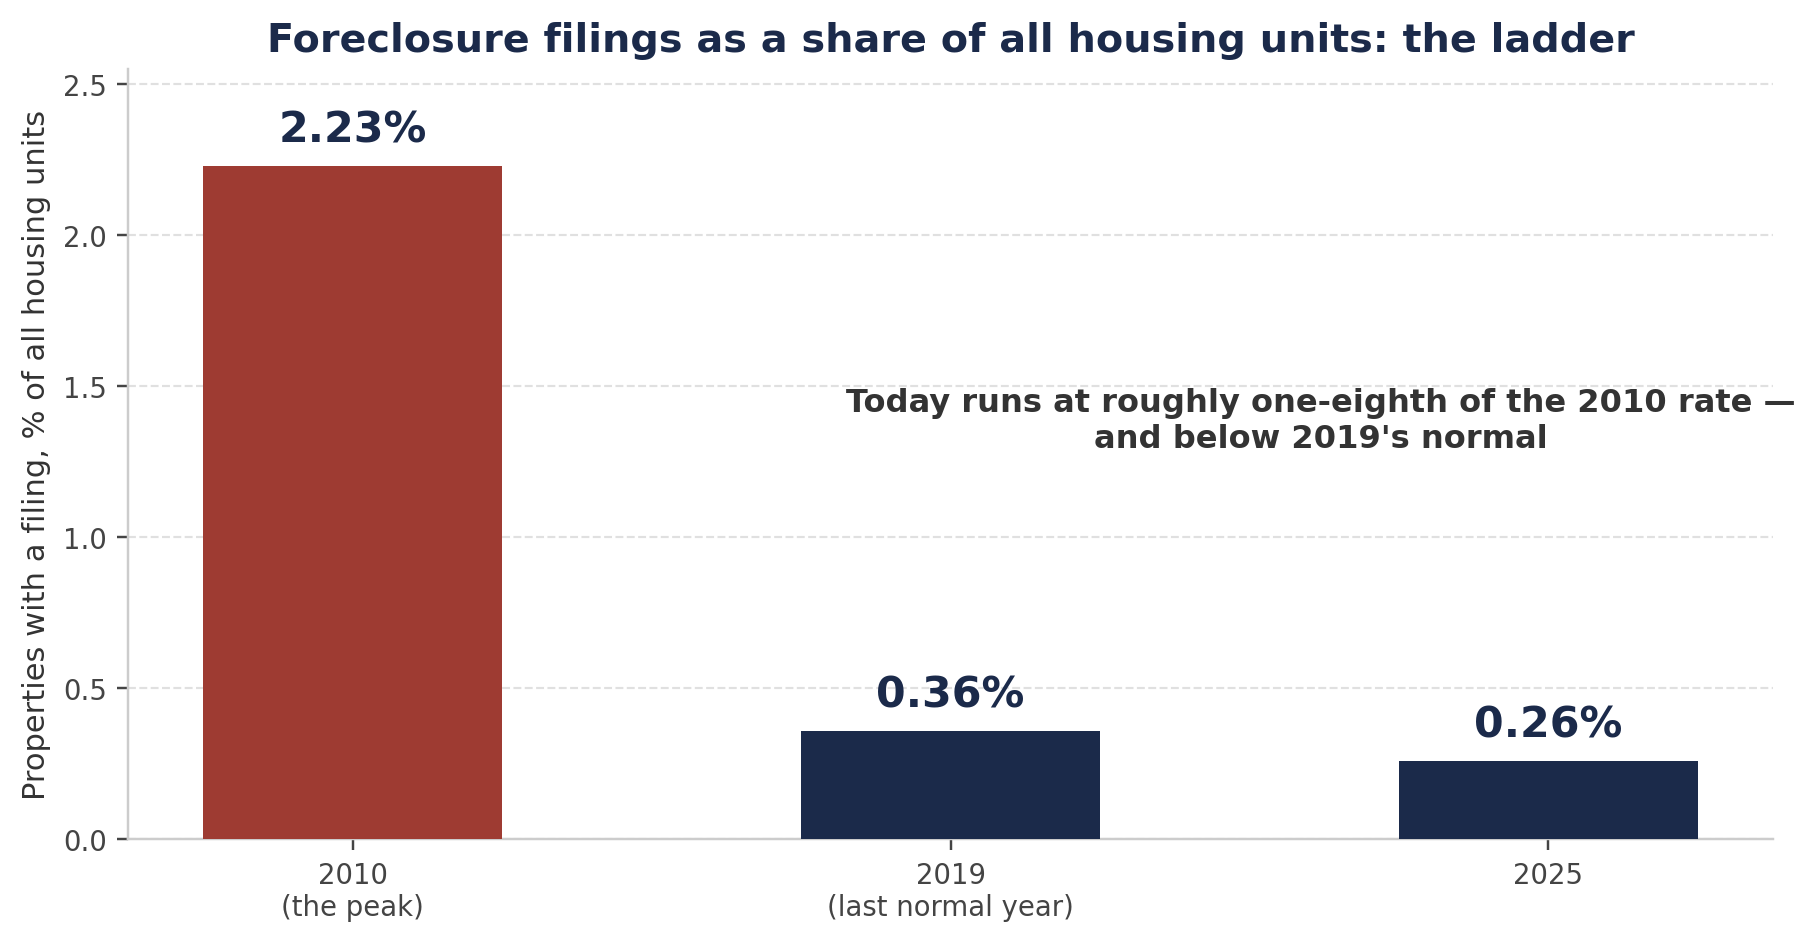
In 2010, at the peak of the worst housing crisis in modern American history, properties with foreclosure filings equaled 2.23% of all housing units in the country. In 2019 — a normal year, pre-pandemic, nobody's idea of a crisis — the figure was 0.36%. In 2025 it was 0.26%.
Read that again. After all the surging, all the red maps, foreclosure filings today run at roughly one-eighth of the 2010 rate — and still below the last normal year. Full-year 2025 filings totaled 367,460 properties: up 14% from 2024, down 25% from 2019, down 87% from the 2010 peak of nearly 2.9 million.
The take-backs tell the same story in absolute houses. Banks repossessed 1,050,500 homes in 2010. In 2019 they repossessed 143,955. In 2025: 46,439 — down 96% from the peak. Annualize August 2026's REOs and you get a pace of roughly 69,500 a year — the famous 42% surge, and it still lands at about half of 2019's count.
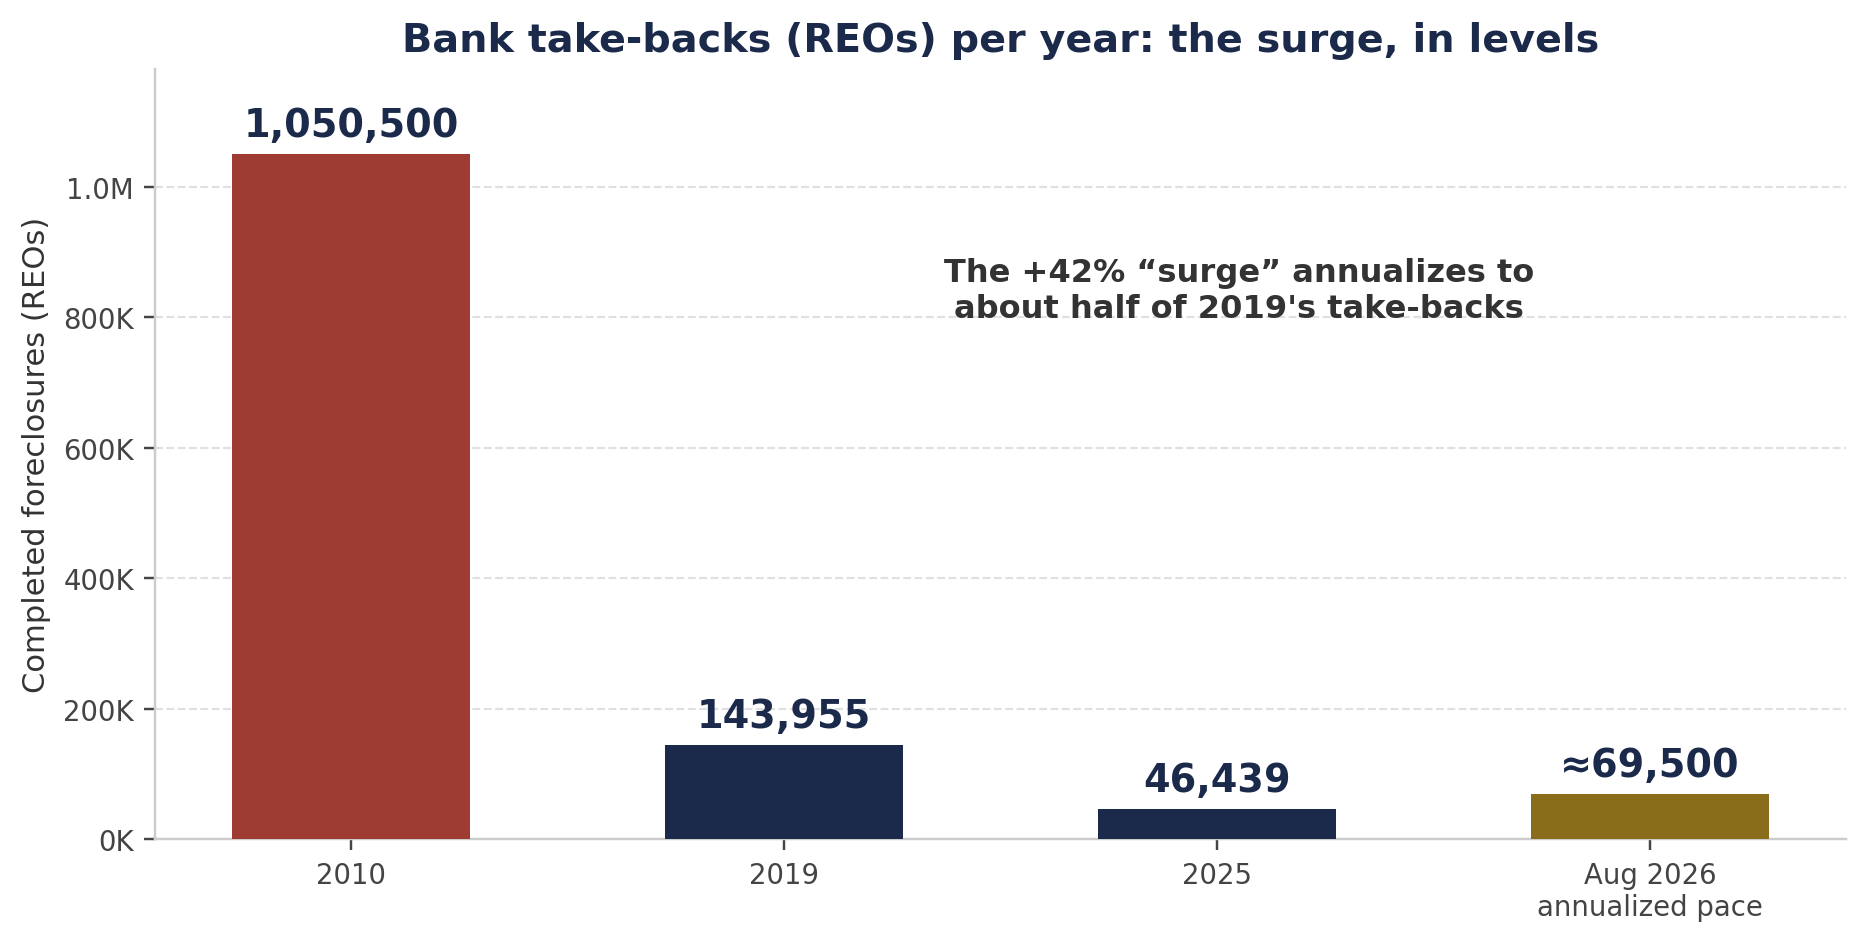
This is what normalization looks like. A system thawing from an artificial freeze back toward its ordinary background level — a background level that was itself historically quiet.
Why the back of the pipeline spikes while the front stays calm
One more mechanic the poster skips, because it ruins the mood.
REOs are the end of the pipeline. A bank take-back in August 2026 is the finish line of a case that started months or years earlier — often a pandemic-era or post-pandemic case finally working through a slow court. In judicial-foreclosure states the timeline is measured in years: Louisiana averaged 3,461 days to foreclose in the fourth quarter of 2025. Nine and a half years.
So yes, REOs can jump 42% while starts rise only 7%. That's not a contradiction. That's a backlog clearing. The back of the pipeline emptying old cases tells you almost nothing about new distress entering the front. New distress is the starts number. The starts number is 7%.
And the five state percentages at the bottom of the poster — Tennessee starts +145%, Oklahoma +102%, Mississippi +69%, Arkansas +66%, Michigan +50%? Small states, small counts, same frozen base. When a state's monthly starts go from a handful to two handfuls, the percent triples and nothing has happened. Nationally, starts rose 7%. That's the number. The rest is confetti.
Florida is the exception — and it's your buy box
Now the part of this report that actually deserves an operator's attention, because direction matters even when levels are boring.
Florida led the entire nation in foreclosure starts in August — 3,189 of them — with one filing for every 2,397 housing units, third-worst rate in the country behind South Carolina and Nevada. Zoom out to the full year 2025 and Florida posted the worst state foreclosure rate in America: one in every 230 housing units had a filing.
And the worst metro in the country? Lakeland. One in every 145 housing units. Our backyard is the capital of this chart.
Why Florida? ATTOM's CEO, Rob Barber, names the pressures himself: higher insurance costs, higher borrowing costs, everyday living expenses squeezing owners. Florida's insurance market is its own slow-motion disaster stacked on top of 7% money, and it's grinding the thinnest-equity owners first. Barber's own verdict on the national picture, for the record: normalization after unusually quiet years, activity still below pre-pandemic norms. Even the man selling the data won't call it a crisis.
For an operator, this is not a warning. It's a supply schedule. Florida forecloses judicially — through the courts, slowly — so this inventory arrives as a drip, not a flood. No 2009-style wall of bank-owned houses dumping at once. Just a steady, rising stream of forced sellers, month after month, in the exact market where we buy.
Forced sellers are where clearance prices actually print. Not from the listing that sat 63 days at a 2022 anchor. From the courthouse steps, the short sale that has to close, the estate that needs it gone. That pipeline was frozen for half a decade. It's refilling — fastest in Florida, fastest of all in Lakeland — and it refills whether the posters understand percentages or not.
The verdict
Levels say boring. Direction says pay attention. Both can be true, and an operator holds both at once.
A percent without a level is marketing. A percent off a frozen floor is marketing squared. Foreclosures in America are normalizing toward a historically quiet baseline — 0.26% of housing units against 2.23% at the real peak — while the forced-seller pipeline quietly refills in the places where insurance and expensive money bite hardest.
The crowd reads the poster and feels fear. The operator reads the levels and checks his reserves. Houses change hands at real prices when sellers have to sell — and there are more of those sellers every month, right here, on a drip you can plan around.
"Resources ready. Patience intact. Buy from forced sellers, not from headlines."
Sources
ATTOM, August 2026 U.S. Foreclosure Market Report — 40,277 properties with filings (+13% YoY, +1% MoM), one in every 3,569 housing units; foreclosure starts 25,894 (+7% YoY, −3% MoM); completed foreclosures (REOs) 5,794 (+42% YoY, +22% MoM); state rates — South Carolina 1 in 1,547, Nevada 1 in 1,920, Florida 1 in 2,397, Texas 1 in 2,445, Maryland 1 in 2,530; most starts — Florida 3,189, Texas 3,126, California 2,565; state start increases (Tennessee +145%, Oklahoma +102%, Mississippi +69%, Arkansas +66%, Michigan +50%) as published with ATTOM's August 2026 figures. First half of 2026: 227,548 properties with filings (+21% vs H1 2025), REOs +33%. ATTOM, Year-End 2025 U.S. Foreclosure Market Report — 367,460 filings in 2025 (+14% vs 2024, −25% vs 2019, −87% vs the 2010 peak of ~2.9M); filings as a share of housing units 0.26% (2025) vs 0.36% (2019) vs 2.23% (2010); starts 289,441 (+213% vs the 2021 pandemic-era low, −14% vs 2019, −86% vs the 2009 peak of 2,139,005); REOs 46,439 (−68% vs 143,955 in 2019, −96% vs 1,050,500 in 2010); Florida worst state rate at 1 in 230 and Lakeland worst metro at 1 in 145 (full-year 2025); Louisiana longest average time to foreclose, 3,461 days (Q4 2025). August 2026 annualized REO pace (≈69,500) is derived by the author from the August monthly figure and is labeled as an annualized pace wherever used.
Baron Mulberry writes as BlueCollarQuant — blue-collar operator, quant thinking. Real assets, real cycles, no fluff.